
Bias: Long
Technical Analysis & Rationale:
The daily chart for ACME Solar Holdings Ltd. presents a strong bullish setup.
To align with sound technical analysis principles, this idea is supported by multiple chart confluences:
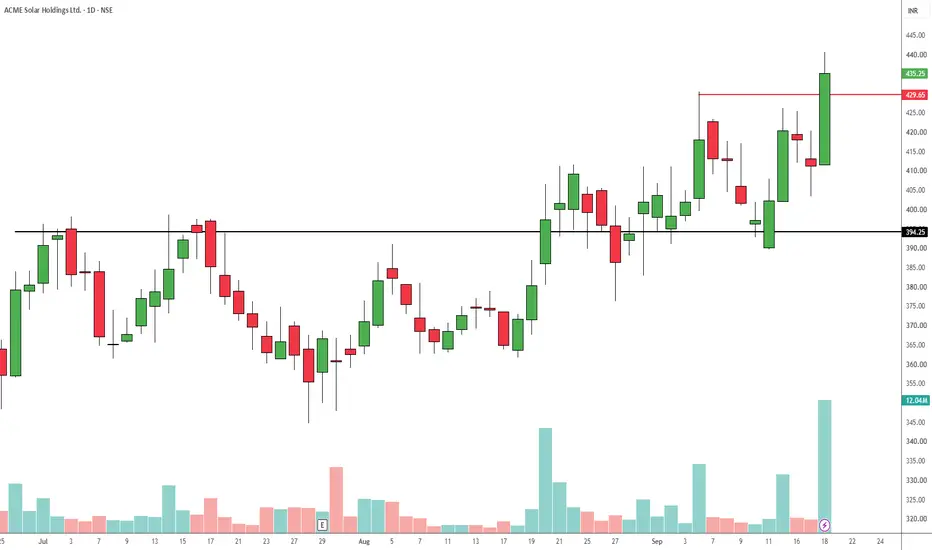
Clear Resistance Breakout: The stock has decisively cleared the overhead resistance at 429.65, marked by the red horizontal line, and closed near the day's high at 435.25.
Volume Confirmation: The breakout is validated by a significant surge in trading volume, visible on the latest daily candle, which highlights strong institutional interest and buying pressure.
Solid Support Floor: A reliable base has been established at the 394.25 level, marked by the black horizontal line, indicating a strong foundation where buyers previously absorbed selling pressure.
Trade Plan:
Entry Strategy: Consider entering long at the current market price of 435.25 or on a slight pullback retesting the 429.65 breakout level.
Target (Short-Term / Immediate Range): ₹465.00
Stop Loss: Place a stop loss below the recent consolidation structure, ideally on a daily close below the 394.25 major support line, to protect capital if the breakout fails.
Trade Duration: This is a short-to-medium-term momentum setup designed to capture the upside price discovery following the high-volume breakout.
Technical Analysis & Rationale:
The daily chart for ACME Solar Holdings Ltd. presents a strong bullish setup.
To align with sound technical analysis principles, this idea is supported by multiple chart confluences:
Clear Resistance Breakout: The stock has decisively cleared the overhead resistance at 429.65, marked by the red horizontal line, and closed near the day's high at 435.25.
Volume Confirmation: The breakout is validated by a significant surge in trading volume, visible on the latest daily candle, which highlights strong institutional interest and buying pressure.
Solid Support Floor: A reliable base has been established at the 394.25 level, marked by the black horizontal line, indicating a strong foundation where buyers previously absorbed selling pressure.
Trade Plan:
Entry Strategy: Consider entering long at the current market price of 435.25 or on a slight pullback retesting the 429.65 breakout level.
Target (Short-Term / Immediate Range): ₹465.00
Stop Loss: Place a stop loss below the recent consolidation structure, ideally on a daily close below the 394.25 major support line, to protect capital if the breakout fails.
Trade Duration: This is a short-to-medium-term momentum setup designed to capture the upside price discovery following the high-volume breakout.
Trade closed: stop reached
Stoploss hit.
Disclaimer
The information and publications are not meant to be, and do not constitute, financial, investment, trading, or other types of advice or recommendations supplied or endorsed by TradingView. Read more in the Terms of Use.
Disclaimer
The information and publications are not meant to be, and do not constitute, financial, investment, trading, or other types of advice or recommendations supplied or endorsed by TradingView. Read more in the Terms of Use.