
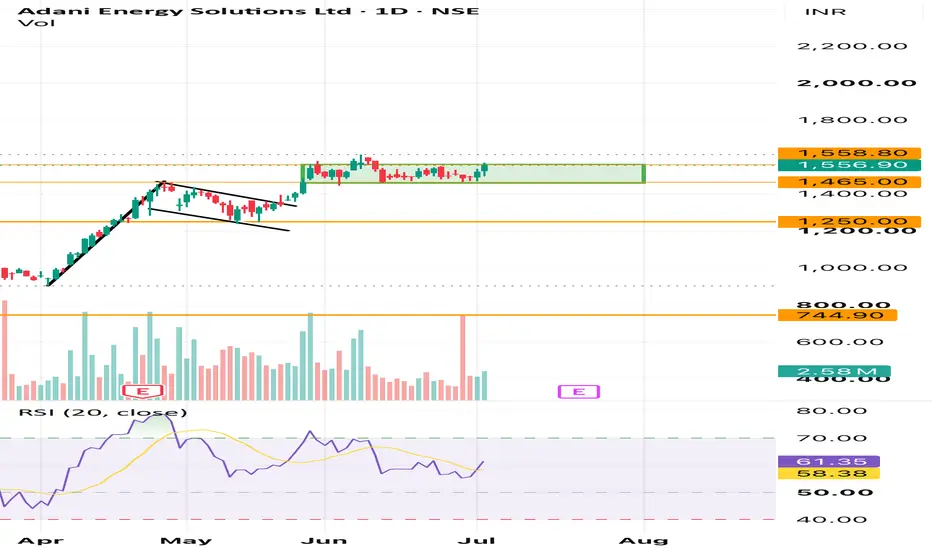
Adani Energy Solutions Ltd. – Daily Chart Review
Adani Energy Solutions continues to trade in a strong primary uptrend, but the price has spent the last several weeks consolidating in a narrow range between ₹1,465 and ₹1,560. This appears to be a healthy pause after a sharp impulsive rally rather than a sign of trend reversal.
Technical Observations
* Rectangle Consolidation: Price is respecting a well-defined sideways range. Such consolidations often act as continuation patterns when they occur after a strong rally.
* Trend Structure: Higher highs and higher lows remain intact on the daily timeframe, indicating bulls are still in control.
* Volume: Volume has moderated during consolidation, which is constructive. A breakout accompanied by above-average volume would significantly improve the probability of trend continuation.
* RSI: RSI is around 61 and has turned upward after cooling off from earlier highs. This suggests bullish momentum is rebuilding. No major bearish divergence is visible at the moment.
Key Levels
* Immediate Resistance: ₹1,560–1,565
* Major Support: ₹1,465
* Positional Support: ₹1,250
Trading Plan
Bullish Scenario
* A decisive daily close above ₹1,560–1,565 with strong volume can trigger the next leg of the uptrend.
* Possible upside targets:
* ₹1,650
* ₹1,730
* ₹1,820 (if momentum remains strong)
Bearish Scenario
* Failure to hold ₹1,465 may result in profit booking towards ₹1,380–1,350 initially.
* The broader trend remains bullish unless the stock starts closing below ₹1,250.
Conclusion
The stock is showing characteristics of a bullish continuation setup. Consolidation after a sharp advance generally strengthens the trend by allowing momentum indicators to cool off. Traders should watch for a high-volume breakout above the range rather than anticipating it prematurely. Until the range is resolved, expect choppy price action.
Disclaimer: This analysis is for educational purposes only and reflects my personal interpretation of the chart. Please conduct your own research and manage risk appropriately before making any investment decisions.
Adani Energy Solutions continues to trade in a strong primary uptrend, but the price has spent the last several weeks consolidating in a narrow range between ₹1,465 and ₹1,560. This appears to be a healthy pause after a sharp impulsive rally rather than a sign of trend reversal.
Technical Observations
* Rectangle Consolidation: Price is respecting a well-defined sideways range. Such consolidations often act as continuation patterns when they occur after a strong rally.
* Trend Structure: Higher highs and higher lows remain intact on the daily timeframe, indicating bulls are still in control.
* Volume: Volume has moderated during consolidation, which is constructive. A breakout accompanied by above-average volume would significantly improve the probability of trend continuation.
* RSI: RSI is around 61 and has turned upward after cooling off from earlier highs. This suggests bullish momentum is rebuilding. No major bearish divergence is visible at the moment.
Key Levels
* Immediate Resistance: ₹1,560–1,565
* Major Support: ₹1,465
* Positional Support: ₹1,250
Trading Plan
Bullish Scenario
* A decisive daily close above ₹1,560–1,565 with strong volume can trigger the next leg of the uptrend.
* Possible upside targets:
* ₹1,650
* ₹1,730
* ₹1,820 (if momentum remains strong)
Bearish Scenario
* Failure to hold ₹1,465 may result in profit booking towards ₹1,380–1,350 initially.
* The broader trend remains bullish unless the stock starts closing below ₹1,250.
Conclusion
The stock is showing characteristics of a bullish continuation setup. Consolidation after a sharp advance generally strengthens the trend by allowing momentum indicators to cool off. Traders should watch for a high-volume breakout above the range rather than anticipating it prematurely. Until the range is resolved, expect choppy price action.
Disclaimer: This analysis is for educational purposes only and reflects my personal interpretation of the chart. Please conduct your own research and manage risk appropriately before making any investment decisions.

Disclaimer
The information and publications are not meant to be, and do not constitute, financial, investment, trading, or other types of advice or recommendations supplied or endorsed by TradingView. Read more in the Terms of Use.
Disclaimer
The information and publications are not meant to be, and do not constitute, financial, investment, trading, or other types of advice or recommendations supplied or endorsed by TradingView. Read more in the Terms of Use.