
Apoorv Dubey | SEBI Registered Research Analyst | INH000030287
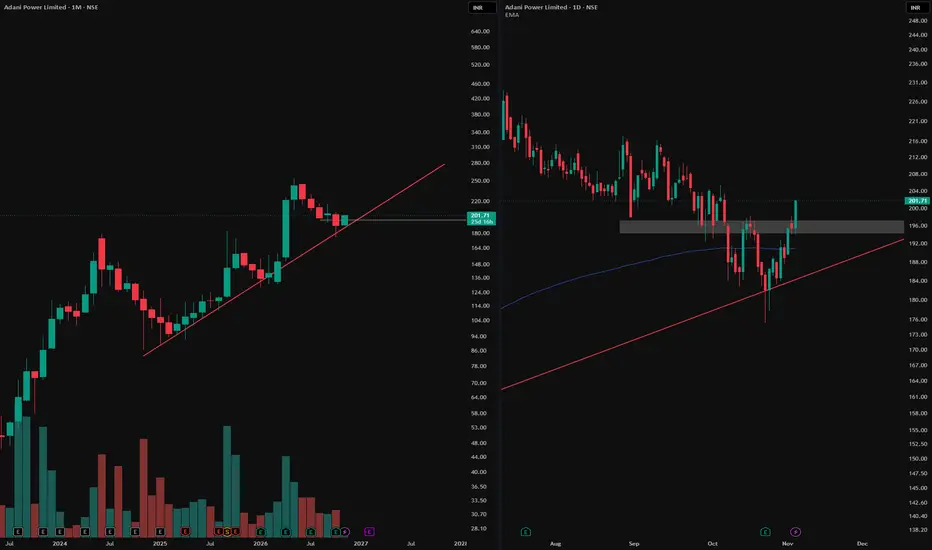
Monthly chart (left): The red line marks rising support. Price has reacted around this trendline several times, making it a useful reference for the broader trend.
Daily chart (right): Zoom in on the latest reaction and you’ll see a W-shaped bottom. The grey zone first acted as support, then became resistance after price broke below it. It also marked the area of the rebound between the two lows. The latest daily candle closed above that zone, reclaiming it.
The takeaway: The monthly chart shows where price reacted. The daily chart shows how the reversal developed. A close above the grey zone marks the breakout on this chart; whether price holds above it is a separate question.
For educational purposes only. This is not a recommendation to buy, sell or hold Adani Power or any other security.
Monthly chart (left): The red line marks rising support. Price has reacted around this trendline several times, making it a useful reference for the broader trend.
Daily chart (right): Zoom in on the latest reaction and you’ll see a W-shaped bottom. The grey zone first acted as support, then became resistance after price broke below it. It also marked the area of the rebound between the two lows. The latest daily candle closed above that zone, reclaiming it.
The takeaway: The monthly chart shows where price reacted. The daily chart shows how the reversal developed. A close above the grey zone marks the breakout on this chart; whether price holds above it is a separate question.
For educational purposes only. This is not a recommendation to buy, sell or hold Adani Power or any other security.

📊Swing & positional research with Buy, Sell & Hold recommendations
Contact for NOVEMBER SLOTS
📞WhatsApp ( Pro ): wa.me/919455664601
📢Free Picks on Telegram ( Join ) : t.me/hashtaghammer
Apoorv Dubey|SEBI RA INH000030287
Contact for NOVEMBER SLOTS
📞WhatsApp ( Pro ): wa.me/919455664601
📢Free Picks on Telegram ( Join ) : t.me/hashtaghammer
Apoorv Dubey|SEBI RA INH000030287
Related publications
Disclaimer
The information and publications are not meant to be, and do not constitute, financial, investment, trading, or other types of advice or recommendations supplied or endorsed by TradingView. Read more in the Terms of Use.
📊Swing & positional research with Buy, Sell & Hold recommendations
Contact for NOVEMBER SLOTS
📞WhatsApp ( Pro ): wa.me/919455664601
📢Free Picks on Telegram ( Join ) : t.me/hashtaghammer
Apoorv Dubey|SEBI RA INH000030287
Contact for NOVEMBER SLOTS
📞WhatsApp ( Pro ): wa.me/919455664601
📢Free Picks on Telegram ( Join ) : t.me/hashtaghammer
Apoorv Dubey|SEBI RA INH000030287
Related publications
Disclaimer
The information and publications are not meant to be, and do not constitute, financial, investment, trading, or other types of advice or recommendations supplied or endorsed by TradingView. Read more in the Terms of Use.