
Aegis Vopak Terminals Ltd — Weekly Chart Study
NSE: AEGISVOPAK
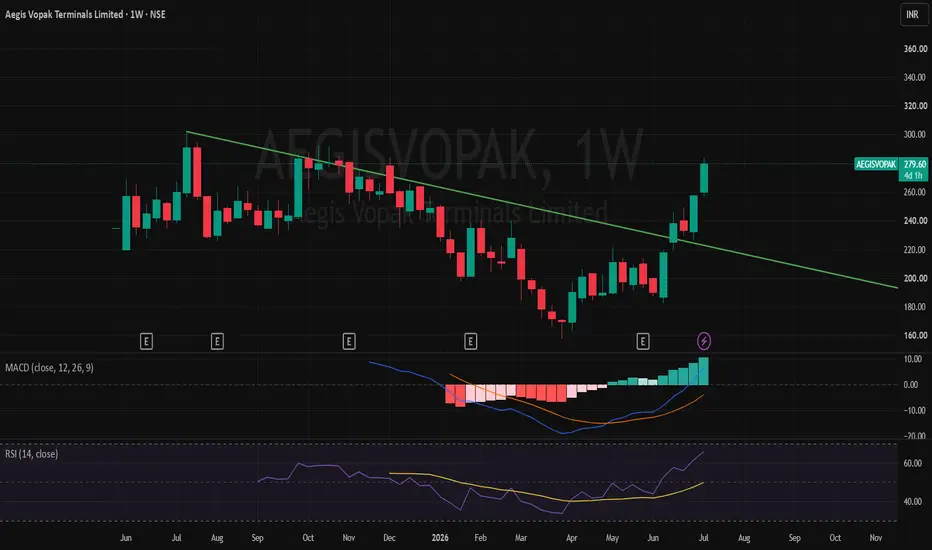
AEGISVOPAK is showing a strong weekly breakout attempt after a prolonged corrective phase. Price has moved above the falling trendline and is now testing an important resistance / breakout zone near the recent highs.
The weekly structure has improved meaningfully. RSI is rising into a stronger zone, while MACD has turned positive with improving histogram strength, indicating that downside pressure has reduced and momentum is building.
The key area to track now is the ₹275–280 zone. Sustained weekly closing above this area can strengthen the breakout structure further. If price sustains above this zone, the next important areas to watch are around ₹295–300, followed by ₹320–330.
On the downside, ₹255–260 now becomes an important near-term support zone. Below that, ₹230–235 remains the broader support area to track.
Key levels:
Support: ₹255–260
Major support: ₹230–235
Breakout / sustain zone: ₹275–280
Resistance: ₹295–300 / ₹320–330
For now, AEGISVOPAK looks like a weekly breakout / trend-improvement setup, but stronger confirmation will depend on sustained price action above the breakout zone with healthy volume.
Shared only for educational study and chart-tracking purpose. This is not a buy/sell recommendation or investment advice. I am not a SEBI registered advisor. Please do your own research or consult a qualified financial advisor before taking any investment decision. I am not responsible for any profit or loss based on this post.
NSE: AEGISVOPAK
AEGISVOPAK is showing a strong weekly breakout attempt after a prolonged corrective phase. Price has moved above the falling trendline and is now testing an important resistance / breakout zone near the recent highs.
The weekly structure has improved meaningfully. RSI is rising into a stronger zone, while MACD has turned positive with improving histogram strength, indicating that downside pressure has reduced and momentum is building.
The key area to track now is the ₹275–280 zone. Sustained weekly closing above this area can strengthen the breakout structure further. If price sustains above this zone, the next important areas to watch are around ₹295–300, followed by ₹320–330.
On the downside, ₹255–260 now becomes an important near-term support zone. Below that, ₹230–235 remains the broader support area to track.
Key levels:
Support: ₹255–260
Major support: ₹230–235
Breakout / sustain zone: ₹275–280
Resistance: ₹295–300 / ₹320–330
For now, AEGISVOPAK looks like a weekly breakout / trend-improvement setup, but stronger confirmation will depend on sustained price action above the breakout zone with healthy volume.
Shared only for educational study and chart-tracking purpose. This is not a buy/sell recommendation or investment advice. I am not a SEBI registered advisor. Please do your own research or consult a qualified financial advisor before taking any investment decision. I am not responsible for any profit or loss based on this post.

Disclaimer
The information and publications are not meant to be, and do not constitute, financial, investment, trading, or other types of advice or recommendations supplied or endorsed by TradingView. Read more in the Terms of Use.
Disclaimer
The information and publications are not meant to be, and do not constitute, financial, investment, trading, or other types of advice or recommendations supplied or endorsed by TradingView. Read more in the Terms of Use.