
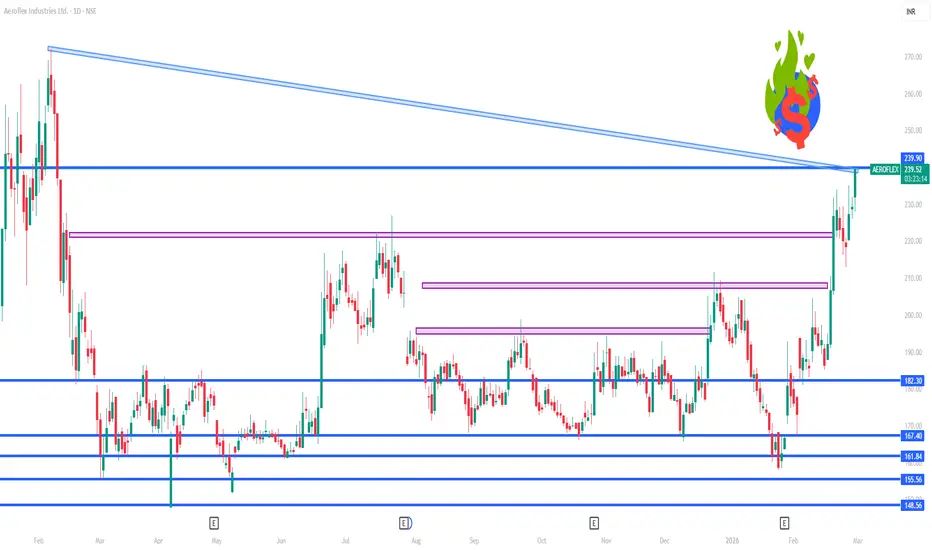
📊 Current Status
The stock is trading around ~₹229 – ₹234 range on NSE (latest session data).
🔑 Daily Pivot & Key Levels
📈 Resistance Levels (Upside Targets)
These are key levels where price may face selling pressure:
R1: ~₹232–₹234 (first major resistance)
R2: ~₹242–₹243 (next resistance)
R3: ~₹249–₹250+ (extended area)
Short-term upside is likely capped unless price sustains above the ₹234 zone.
📉 Support Levels (Downside Defense)
These levels could act as pullback buffers:
S1: ~₹220–₹223 (immediate support)
S2: ~₹212–₹215 (mid support)
S3: ~₹203–₹206 (deeper support)
Break below S1 would signal weakness and possible deeper correction toward S2/S3.
🟡 Pivot Reference Point
Pivot: ~₹227–₹231 (central reference of daily price range)
Price above pivot suggests bullish bias for the day; below pivot suggests bearish bias.
📈 Technical Indicators on Daily Chart
Short & long-term moving averages are positioned bullishly, suggesting an overall uptrend bias.
RSI (~65) suggests strength but not extreme overbought.
MACD and other indicators on daily frame give a bullish lean.
📌 Daily Trading Notes
Bullish scenario: Sustained trade above the pivot and above ₹234 may open the way toward ₹242–₹250+.
Bearish scenario: Failure near resistance or breakdown below ₹220–₹223 could trigger a pullback to ₹212–₹206.
Intraday range often sees volatility (~₹10–₹15) on such stocks.
The stock is trading around ~₹229 – ₹234 range on NSE (latest session data).
🔑 Daily Pivot & Key Levels
📈 Resistance Levels (Upside Targets)
These are key levels where price may face selling pressure:
R1: ~₹232–₹234 (first major resistance)
R2: ~₹242–₹243 (next resistance)
R3: ~₹249–₹250+ (extended area)
Short-term upside is likely capped unless price sustains above the ₹234 zone.
📉 Support Levels (Downside Defense)
These levels could act as pullback buffers:
S1: ~₹220–₹223 (immediate support)
S2: ~₹212–₹215 (mid support)
S3: ~₹203–₹206 (deeper support)
Break below S1 would signal weakness and possible deeper correction toward S2/S3.
🟡 Pivot Reference Point
Pivot: ~₹227–₹231 (central reference of daily price range)
Price above pivot suggests bullish bias for the day; below pivot suggests bearish bias.
📈 Technical Indicators on Daily Chart
Short & long-term moving averages are positioned bullishly, suggesting an overall uptrend bias.
RSI (~65) suggests strength but not extreme overbought.
MACD and other indicators on daily frame give a bullish lean.
📌 Daily Trading Notes
Bullish scenario: Sustained trade above the pivot and above ₹234 may open the way toward ₹242–₹250+.
Bearish scenario: Failure near resistance or breakdown below ₹220–₹223 could trigger a pullback to ₹212–₹206.
Intraday range often sees volatility (~₹10–₹15) on such stocks.

Contact Knowledgehub for a detailed consultation: Dm on WhatsApp: [wa.link/a2o0kz]-
Phone No: [+91 93102 26243]-
Email: [tradingviewknowledgehub@gmail.com]---
-- Let’s achieve success together!
Phone No: [+91 93102 26243]-
Email: [tradingviewknowledgehub@gmail.com]---
-- Let’s achieve success together!
Related publications
Disclaimer
The information and publications are not meant to be, and do not constitute, financial, investment, trading, or other types of advice or recommendations supplied or endorsed by TradingView. Read more in the Terms of Use.
Contact Knowledgehub for a detailed consultation: Dm on WhatsApp: [wa.link/a2o0kz]-
Phone No: [+91 93102 26243]-
Email: [tradingviewknowledgehub@gmail.com]---
-- Let’s achieve success together!
Phone No: [+91 93102 26243]-
Email: [tradingviewknowledgehub@gmail.com]---
-- Let’s achieve success together!
Related publications
Disclaimer
The information and publications are not meant to be, and do not constitute, financial, investment, trading, or other types of advice or recommendations supplied or endorsed by TradingView. Read more in the Terms of Use.