
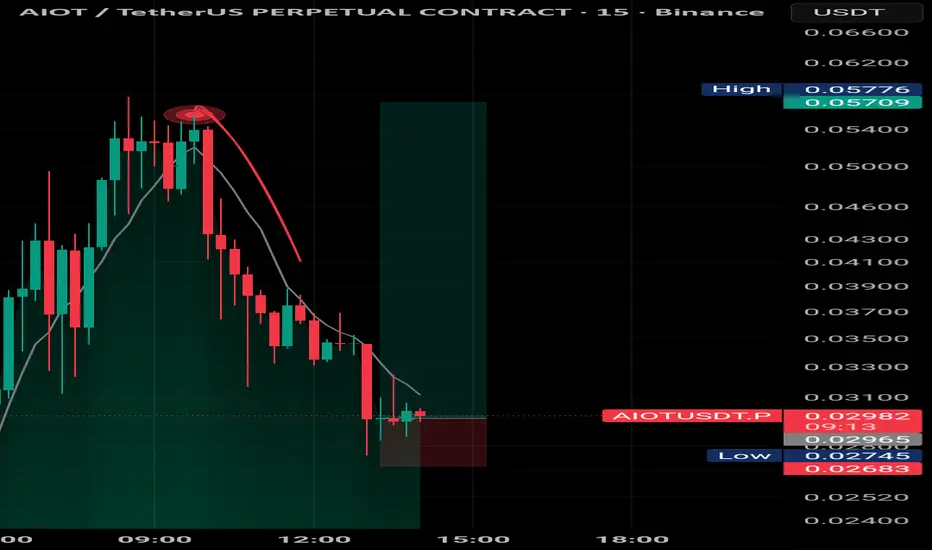
Based on the chart provided for AIOT/TetherUS Perpetual on the 15-minute timeframe, here is a technical breakdown of the current price action and the setup you have highlighted.
Current Market Context
Asset: AIOTUSDT.P (AIOT Perpetual Futures)
Timeframe: 15m (Short-term intraday)
Trend: Strongly Bearish. The price has undergone a massive sell-off from a high of approximately 0.05776 down to the current level of 0.02992.
Momentum: The steep angle of the red candles and the position below the moving average (the grey line) suggest intense selling pressure with very little retracement during the drop.
The Setup: Long Position Analysis
You have plotted a "Long" risk/reward tool at the bottom of this crash. Here is what the technicals suggest about this move:
1. Support & Bottom Fishing
The price is currently hovering around 0.02992, which appears to be a local psychological support. You’ve placed your "Stop Loss" just below the recent wick low at 0.02683.
The Logic: This is a "mean reversion" or "bounce" play. After such a vertical drop, the asset is technically oversold, and traders often look for a relief rally.
2. Risk-to-Reward (R:R)
Entry: ~$0.02992
Stop Loss (SL): $0.02683 (Protecting against a continuation of the crash)
Take Profit (TP) Target: Your green box extends back up toward the 0.057 area.
Analysis: While the R:R ratio looks mathematically attractive, targeting the previous all-time high immediately is highly ambitious. In a downtrend this strong, the first major hurdles will be the EMA (grey line) and previous "lower highs" near 0.039 and 0.045.
Key Risks & Considerations
⚠️ Caution: "Catching a falling knife" is one of the riskiest strategies in crypto.
Lack of Consolidation: Currently, there is no "base" or sideways movement to indicate that sellers are exhausted. We see one small green candle, but it hasn't yet engulfed the previous red candle.
The "Dead Cat Bounce": In crashes like this, any upward movement is often just a temporary pause before the price makes a new lower low.
Volatility: AIOT appears to be a high-volatility asset. Tight stop losses can be easily hunted by "wicking" before the actual move happens.
Summary of the Trade Plan
Bullish Case: If $0.02745 (the recent Low) holds, a recovery to the 0.035 - 0.040 zone is a reasonable first target for a relief rally.
Bearish Case: If the price closes a 15m candle below 0.02683, the bearish momentum is likely to continue, and the long setup is invalidated.
Recommendation: Look for a "Double Bottom" pattern or a break above the grey moving average on the 15m chart to confirm that the trend is actually shifting before committing to a full position.
Current Market Context
Asset: AIOTUSDT.P (AIOT Perpetual Futures)
Timeframe: 15m (Short-term intraday)
Trend: Strongly Bearish. The price has undergone a massive sell-off from a high of approximately 0.05776 down to the current level of 0.02992.
Momentum: The steep angle of the red candles and the position below the moving average (the grey line) suggest intense selling pressure with very little retracement during the drop.
The Setup: Long Position Analysis
You have plotted a "Long" risk/reward tool at the bottom of this crash. Here is what the technicals suggest about this move:
1. Support & Bottom Fishing
The price is currently hovering around 0.02992, which appears to be a local psychological support. You’ve placed your "Stop Loss" just below the recent wick low at 0.02683.
The Logic: This is a "mean reversion" or "bounce" play. After such a vertical drop, the asset is technically oversold, and traders often look for a relief rally.
2. Risk-to-Reward (R:R)
Entry: ~$0.02992
Stop Loss (SL): $0.02683 (Protecting against a continuation of the crash)
Take Profit (TP) Target: Your green box extends back up toward the 0.057 area.
Analysis: While the R:R ratio looks mathematically attractive, targeting the previous all-time high immediately is highly ambitious. In a downtrend this strong, the first major hurdles will be the EMA (grey line) and previous "lower highs" near 0.039 and 0.045.
Key Risks & Considerations
⚠️ Caution: "Catching a falling knife" is one of the riskiest strategies in crypto.
Lack of Consolidation: Currently, there is no "base" or sideways movement to indicate that sellers are exhausted. We see one small green candle, but it hasn't yet engulfed the previous red candle.
The "Dead Cat Bounce": In crashes like this, any upward movement is often just a temporary pause before the price makes a new lower low.
Volatility: AIOT appears to be a high-volatility asset. Tight stop losses can be easily hunted by "wicking" before the actual move happens.
Summary of the Trade Plan
Bullish Case: If $0.02745 (the recent Low) holds, a recovery to the 0.035 - 0.040 zone is a reasonable first target for a relief rally.
Bearish Case: If the price closes a 15m candle below 0.02683, the bearish momentum is likely to continue, and the long setup is invalidated.
Recommendation: Look for a "Double Bottom" pattern or a break above the grey moving average on the 15m chart to confirm that the trend is actually shifting before committing to a full position.

Disclaimer
The information and publications are not meant to be, and do not constitute, financial, investment, trading, or other types of advice or recommendations supplied or endorsed by TradingView. Read more in the Terms of Use.
Disclaimer
The information and publications are not meant to be, and do not constitute, financial, investment, trading, or other types of advice or recommendations supplied or endorsed by TradingView. Read more in the Terms of Use.