
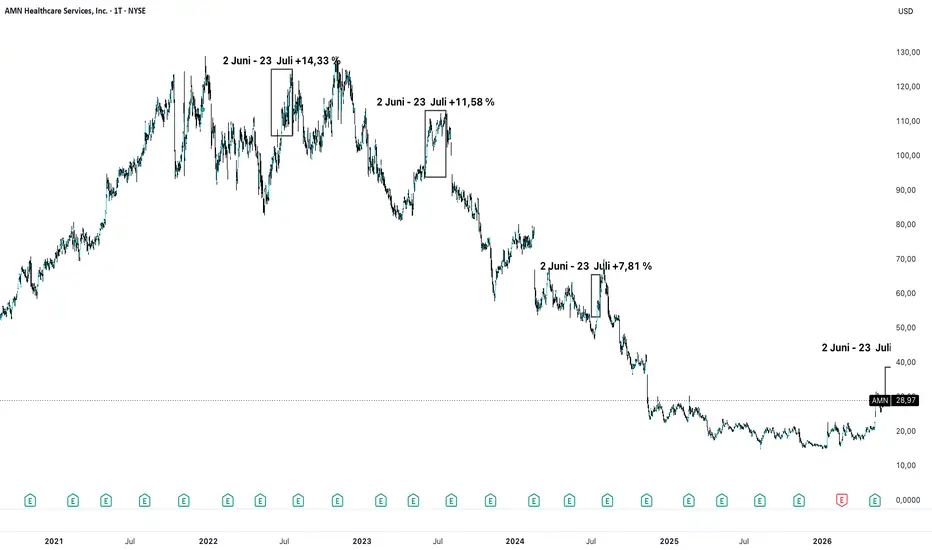
Saisonalität von AMN Healthcare im Fenster 2. Juni – 23. Juli (~51 Tage).
Über die letzten 10 Jahre auffällig konsistent:
• 10 von 10 Jahren positiv (Trefferquote 100 %)
• Ø historische Rendite: +9,53 % (10J)
• Median (10J): +9,69 %
• Pattern Score: 88/100
• größter Rückgang im Fenster: −15,22 %
Beispieljahre (im Chart): 2022 +14,33 % · 2023 +11,58 % · 2024 +7,81 %
Spanne aller Jahre: +2,69 % (2017) bis +22,91 % (2020).
AMN notiert aktuell nahe mehrjähriger Tiefs – das laufende Fenster ist neutral markiert.
Rein historische Betrachtung, keine Prognose, keine Anlageberatung. Vergangene Verläufe wiederholen sich nicht zwangsläufig.
Vollständige Analyse (alle 10 Jahre):
app.stockseaso.com/asset/amn?startDoy=153&endDoy=204&lookback=10&preview=1811707341.ECnYOY8Lm9ITjYyk7_X3CAwjyBSNTjNcfXxh2N6dlBY

Disclaimer
The information and publications are not meant to be, and do not constitute, financial, investment, trading, or other types of advice or recommendations supplied or endorsed by TradingView. Read more in the Terms of Use.
Disclaimer
The information and publications are not meant to be, and do not constitute, financial, investment, trading, or other types of advice or recommendations supplied or endorsed by TradingView. Read more in the Terms of Use.