
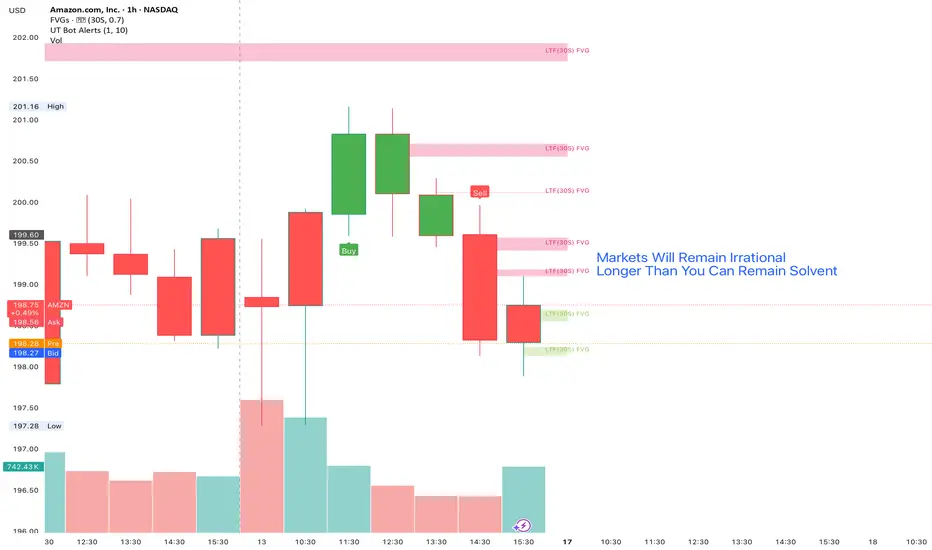
Apple Free Cash Flow Overview
In Apple’s most recent reported quarter (fiscal Q1 2026, ended December 27, 2025), the company generated approximately $51.5 billion in free cash flow (operating cash flow minus capital expenditures).
That figure reflects the cash Apple had available after covering its operating costs and reinvesting in the business during the quarter, and it was up significantly compared with the year-ago period.
For the last twelve months (TTM), Apple’s trailing free cash flow was reported at approximately ~$98.8 billion, based on its most recent fiscal year financials.
⸻
Breakdown of Apple Inc. (AAPL) Free Cash Flow
📌 Most Recent Quarter (Fiscal Q1 2026 — ended Dec 27, 2025)
• Free Cash Flow (Quarter): ≈ $51.5 billion, up strongly year-over-year (about +90.7% vs. the comparable quarter last year).
📌 Trailing Twelve Months (TTM, through Dec 2025)
• Free Cash Flow (TTM): ≈ $123.3 billion, according to certain data tracking services.
📌 Annual Free Cash Flow (Fiscal Year Basis)
• FY 2025 Free Cash Flow: ≈ $98.8 billion, down about ~9% from FY 2024, when it was roughly $108.8 billion.
• FY 2024 Free Cash Flow: ≈ $108.8 billion, which increased versus FY 2023.
• FY 2023 Free Cash Flow: ≈ $99.6 billion.
⸻
📊 Year-Over-Year Trends Summary
Time Period Free Cash Flow (Approx.) YoY Trend
Q1 2026 (latest quarter) ~$51.5 B Strong increase vs. last year (+90.7%)
FY 2025 (annual) ~$98.8 B Down ~9% from FY 2024
FY 2024 (annual) ~$108.8 B Up vs. FY 2023
Key Takeaways
• Apple’s quarterly free cash flow jumped significantly compared with the prior year’s quarter.
• On an annual basis, free cash flow declined modestly in FY 2025 after peaking in FY 2024.
• The TTM free cash flow figure (around $123B) includes the most recent quarters and exceeds the annual reported figure due to timing differences and variations in reporting methodologies.
⸻
Amazon Free Cash Flow Overview
In comparison, here is the latest available free cash flow (FCF) data for Amazon.com, Inc. (AMZN) based on its most recent financial reporting:
📊 Most Recent Figures (Fiscal Year 2025)
• Free Cash Flow (FY 2025): ≈ $7.7 billion (operating cash flow minus capital expenditures for the full year).
🧾 Trailing Twelve Months (TTM — as of Dec 2025)
• TTM Free Cash Flow: ≈ $7.7 billion.
📌 Quarterly Snapshot
• Q4 2025 (Dec 25, 2025 quarter) free cash flow: approximately $14.9 billion.
📉 Key Trend Notes
• Amazon’s free cash flow has declined significantly in recent periods due to much higher capital expenditures, especially for infrastructure and AWS/cloud data centers.
• The TTM free cash flow figure is modest relative to operating cash flow because of heavy reinvestment (capex).
⸻
Amazon Year-Over-Year Breakdown
📌 Most Recent Free Cash Flow (Trailing 12 Months)
For the 12 months ended Dec 31, 2025:
• Free cash flow (TTM): ≈ $11.2 billion, representing operating cash flow minus capital expenditures.
For the same period ended Dec 31, 2024:
• ≈ $38.2 billion.
This represents an approximate ~70% year-over-year decline.
⸻
📈 Year-Over-Year Trend
Amazon’s free cash flow has weakened significantly because the company has been investing heavily in infrastructure, particularly AI and cloud data centers, which increases capital expenditures and reduces residual cash flow.
Period (Trailing 12 Months) Free Cash Flow (Approx.) YoY Change
TTM Dec 2025 ~$11.2 B ↓ ~70% vs. prior year
TTM Dec 2024 ~$38.2 B Reference baseline
TTM mid-2025 (June) ~$18.2 B Mid-year estimates also reflect weaker FCF
⸻
📊 Free Cash Flow vs. Revenue (Margin)
FCF margin measures how much of each revenue dollar converts into free cash flow.
• Revenue (TTM) is roughly $700B+ in late 2025.
• Using FY 2025 revenue of $716B and FCF of $11.2B:
FCF\ Margin ≈ \frac{11.2}{716} ≈ 1.6\%
This is significantly lower than historical levels and well below typical large-cap technology peers such as Apple.
By contrast, in TTM Dec 2024, FCF of ~$38B on similar revenue implies an FCF margin above ~5%.
⸻
Direct Comparison: Apple vs. Amazon
Company Latest FCF (TTM) Latest Quarterly FCF Notes
Apple (AAPL) ≈ $123.3 B ~$51.6 B
Apple has maintained a large, stable free cash flow with strong margins. Amazon (AMZN) in comparison had a much smaller ≈ $7.7 volatile FCF due to heavy capital expenditure.
Key Differences
1. Scale of Cash Generation
Apple’s ~$123B TTM FCF is roughly 15× Amazon’s ~$7.7B.
2. Profitability & Margins
Apple converts a large portion of revenue into FCF.
Amazon reinvests heavily in infrastructure, compressing FCF.
3. Volatility & Trend
Apple’s FCF is consistent.
Amazon’s fluctuates due to capex cycles.
⸻
Valuation Metrics Comparison
📌 Free Cash Flow Margin
• Apple: ~25–28% of revenue
• Amazon: ~1.1%
📌 Free Cash Flow Yield
• Apple: ~2.6–3.1%
• Amazon: ~0.36%
📌 Price-to-Free-Cash-Flow (P/FCF)
• Apple: ~33×
• Amazon: ~280×
⸻
Important Clarification
Stock price does not determine how much revenue converts into free cash flow. FCF margin is an operating outcome, not a valuation outcome.
⸻
However, what would the implied share price be if they did rebalance and achieve an equal FCF margin as Apple?
Hypothetical Scenario: 25% FCF Margin for Amazon
Step 1 — Revenue
~$700B
Step 2 — Target FCF at 25% Margin
0.25 × 700B = 175B
Implied FCF = ~$175B
Step 3 — Valuation at 30× FCF
175B × 30 = 5.25T
Shares outstanding: ~10.5B
5.25T ÷ 10.5B ≈ $500/share
That is good for investors and especially for a stock with no dividend.
⸻
However. It’s more shocking to see the implied share price if the same standard set by Apple was applied to Amazon with regard to yield.
If Amazon traded at a 3% FCF yield:
Current FCF ≈ $11B
\frac{11B}{0.03} ≈ 367B
Implied stock price:
367B ÷ 10.5B ≈ $35/share
That is very bad for investors because it implies that Amazon is currently wildly over valued.
⸻
Amazon would need approximately ~$64B in annual FCF to justify its current stock price at a 3% yield.
Market cap:
199 × 10.7B ≈ 2.13T
Required FCF:
0.03 × 2.13T ≈ 64B
⸻
If Amazon Generated $64B in FCF
\frac{64B}{0.03} ≈ 2.13T
Share price:
2.13T ÷ 10.73B ≈ $198–$200
This aligns closely with current trading levels. However, this isn’t cash in the bank. It is forward leaning and based upon projection.
⸻
Conservative Strategy Balance Sheet Impact
If Amazon reduced capital expenditures:
• FCF could rise from ~$10B toward ~$40–60B+ annually
• Cash balances would increase
• Net cash position could expand
• Debt could be reduced faster
• ROIC would improve
• Share buybacks or dividends could become feasible
However, this would represent a shift away from its aggressive reinvestment strategy focused on AWS, AI infrastructure, and logistics scale.
⸻
Final Conclusion
Apple is a significantly larger and more consistent free cash flow generator than Amazon. After the Great Financial Crisis of 08 the investors that came out on top were already in cash or had large cash reserves ready to spend when the market had bottomed.
Amazon’s valuation reflects expectations of substantial future FCF growth rather than current cash generation levels. This is not money in the bank.
A conservative pivot to increase cash reserves would strengthen Amazon’s balance sheet but could alter its long-term growth trajectory. However, how much growth can be achieved if there are no truly buyers or clear stories on how AI will be profitable?
In Apple’s most recent reported quarter (fiscal Q1 2026, ended December 27, 2025), the company generated approximately $51.5 billion in free cash flow (operating cash flow minus capital expenditures).
That figure reflects the cash Apple had available after covering its operating costs and reinvesting in the business during the quarter, and it was up significantly compared with the year-ago period.
For the last twelve months (TTM), Apple’s trailing free cash flow was reported at approximately ~$98.8 billion, based on its most recent fiscal year financials.
⸻
Breakdown of Apple Inc. (AAPL) Free Cash Flow
📌 Most Recent Quarter (Fiscal Q1 2026 — ended Dec 27, 2025)
• Free Cash Flow (Quarter): ≈ $51.5 billion, up strongly year-over-year (about +90.7% vs. the comparable quarter last year).
📌 Trailing Twelve Months (TTM, through Dec 2025)
• Free Cash Flow (TTM): ≈ $123.3 billion, according to certain data tracking services.
📌 Annual Free Cash Flow (Fiscal Year Basis)
• FY 2025 Free Cash Flow: ≈ $98.8 billion, down about ~9% from FY 2024, when it was roughly $108.8 billion.
• FY 2024 Free Cash Flow: ≈ $108.8 billion, which increased versus FY 2023.
• FY 2023 Free Cash Flow: ≈ $99.6 billion.
⸻
📊 Year-Over-Year Trends Summary
Time Period Free Cash Flow (Approx.) YoY Trend
Q1 2026 (latest quarter) ~$51.5 B Strong increase vs. last year (+90.7%)
FY 2025 (annual) ~$98.8 B Down ~9% from FY 2024
FY 2024 (annual) ~$108.8 B Up vs. FY 2023
Key Takeaways
• Apple’s quarterly free cash flow jumped significantly compared with the prior year’s quarter.
• On an annual basis, free cash flow declined modestly in FY 2025 after peaking in FY 2024.
• The TTM free cash flow figure (around $123B) includes the most recent quarters and exceeds the annual reported figure due to timing differences and variations in reporting methodologies.
⸻
Amazon Free Cash Flow Overview
In comparison, here is the latest available free cash flow (FCF) data for Amazon.com, Inc. (AMZN) based on its most recent financial reporting:
📊 Most Recent Figures (Fiscal Year 2025)
• Free Cash Flow (FY 2025): ≈ $7.7 billion (operating cash flow minus capital expenditures for the full year).
🧾 Trailing Twelve Months (TTM — as of Dec 2025)
• TTM Free Cash Flow: ≈ $7.7 billion.
📌 Quarterly Snapshot
• Q4 2025 (Dec 25, 2025 quarter) free cash flow: approximately $14.9 billion.
📉 Key Trend Notes
• Amazon’s free cash flow has declined significantly in recent periods due to much higher capital expenditures, especially for infrastructure and AWS/cloud data centers.
• The TTM free cash flow figure is modest relative to operating cash flow because of heavy reinvestment (capex).
⸻
Amazon Year-Over-Year Breakdown
📌 Most Recent Free Cash Flow (Trailing 12 Months)
For the 12 months ended Dec 31, 2025:
• Free cash flow (TTM): ≈ $11.2 billion, representing operating cash flow minus capital expenditures.
For the same period ended Dec 31, 2024:
• ≈ $38.2 billion.
This represents an approximate ~70% year-over-year decline.
⸻
📈 Year-Over-Year Trend
Amazon’s free cash flow has weakened significantly because the company has been investing heavily in infrastructure, particularly AI and cloud data centers, which increases capital expenditures and reduces residual cash flow.
Period (Trailing 12 Months) Free Cash Flow (Approx.) YoY Change
TTM Dec 2025 ~$11.2 B ↓ ~70% vs. prior year
TTM Dec 2024 ~$38.2 B Reference baseline
TTM mid-2025 (June) ~$18.2 B Mid-year estimates also reflect weaker FCF
⸻
📊 Free Cash Flow vs. Revenue (Margin)
FCF margin measures how much of each revenue dollar converts into free cash flow.
• Revenue (TTM) is roughly $700B+ in late 2025.
• Using FY 2025 revenue of $716B and FCF of $11.2B:
FCF\ Margin ≈ \frac{11.2}{716} ≈ 1.6\%
This is significantly lower than historical levels and well below typical large-cap technology peers such as Apple.
By contrast, in TTM Dec 2024, FCF of ~$38B on similar revenue implies an FCF margin above ~5%.
⸻
Direct Comparison: Apple vs. Amazon
Company Latest FCF (TTM) Latest Quarterly FCF Notes
Apple (AAPL) ≈ $123.3 B ~$51.6 B
Apple has maintained a large, stable free cash flow with strong margins. Amazon (AMZN) in comparison had a much smaller ≈ $7.7 volatile FCF due to heavy capital expenditure.
Key Differences
1. Scale of Cash Generation
Apple’s ~$123B TTM FCF is roughly 15× Amazon’s ~$7.7B.
2. Profitability & Margins
Apple converts a large portion of revenue into FCF.
Amazon reinvests heavily in infrastructure, compressing FCF.
3. Volatility & Trend
Apple’s FCF is consistent.
Amazon’s fluctuates due to capex cycles.
⸻
Valuation Metrics Comparison
📌 Free Cash Flow Margin
• Apple: ~25–28% of revenue
• Amazon: ~1.1%
📌 Free Cash Flow Yield
• Apple: ~2.6–3.1%
• Amazon: ~0.36%
📌 Price-to-Free-Cash-Flow (P/FCF)
• Apple: ~33×
• Amazon: ~280×
⸻
Important Clarification
Stock price does not determine how much revenue converts into free cash flow. FCF margin is an operating outcome, not a valuation outcome.
⸻
However, what would the implied share price be if they did rebalance and achieve an equal FCF margin as Apple?
Hypothetical Scenario: 25% FCF Margin for Amazon
Step 1 — Revenue
~$700B
Step 2 — Target FCF at 25% Margin
0.25 × 700B = 175B
Implied FCF = ~$175B
Step 3 — Valuation at 30× FCF
175B × 30 = 5.25T
Shares outstanding: ~10.5B
5.25T ÷ 10.5B ≈ $500/share
That is good for investors and especially for a stock with no dividend.
⸻
However. It’s more shocking to see the implied share price if the same standard set by Apple was applied to Amazon with regard to yield.
If Amazon traded at a 3% FCF yield:
Current FCF ≈ $11B
\frac{11B}{0.03} ≈ 367B
Implied stock price:
367B ÷ 10.5B ≈ $35/share
That is very bad for investors because it implies that Amazon is currently wildly over valued.
⸻
Amazon would need approximately ~$64B in annual FCF to justify its current stock price at a 3% yield.
Market cap:
199 × 10.7B ≈ 2.13T
Required FCF:
0.03 × 2.13T ≈ 64B
⸻
If Amazon Generated $64B in FCF
\frac{64B}{0.03} ≈ 2.13T
Share price:
2.13T ÷ 10.73B ≈ $198–$200
This aligns closely with current trading levels. However, this isn’t cash in the bank. It is forward leaning and based upon projection.
⸻
Conservative Strategy Balance Sheet Impact
If Amazon reduced capital expenditures:
• FCF could rise from ~$10B toward ~$40–60B+ annually
• Cash balances would increase
• Net cash position could expand
• Debt could be reduced faster
• ROIC would improve
• Share buybacks or dividends could become feasible
However, this would represent a shift away from its aggressive reinvestment strategy focused on AWS, AI infrastructure, and logistics scale.
⸻
Final Conclusion
Apple is a significantly larger and more consistent free cash flow generator than Amazon. After the Great Financial Crisis of 08 the investors that came out on top were already in cash or had large cash reserves ready to spend when the market had bottomed.
Amazon’s valuation reflects expectations of substantial future FCF growth rather than current cash generation levels. This is not money in the bank.
A conservative pivot to increase cash reserves would strengthen Amazon’s balance sheet but could alter its long-term growth trajectory. However, how much growth can be achieved if there are no truly buyers or clear stories on how AI will be profitable?

Disclaimer
The information and publications are not meant to be, and do not constitute, financial, investment, trading, or other types of advice or recommendations supplied or endorsed by TradingView. Read more in the Terms of Use.
Disclaimer
The information and publications are not meant to be, and do not constitute, financial, investment, trading, or other types of advice or recommendations supplied or endorsed by TradingView. Read more in the Terms of Use.