
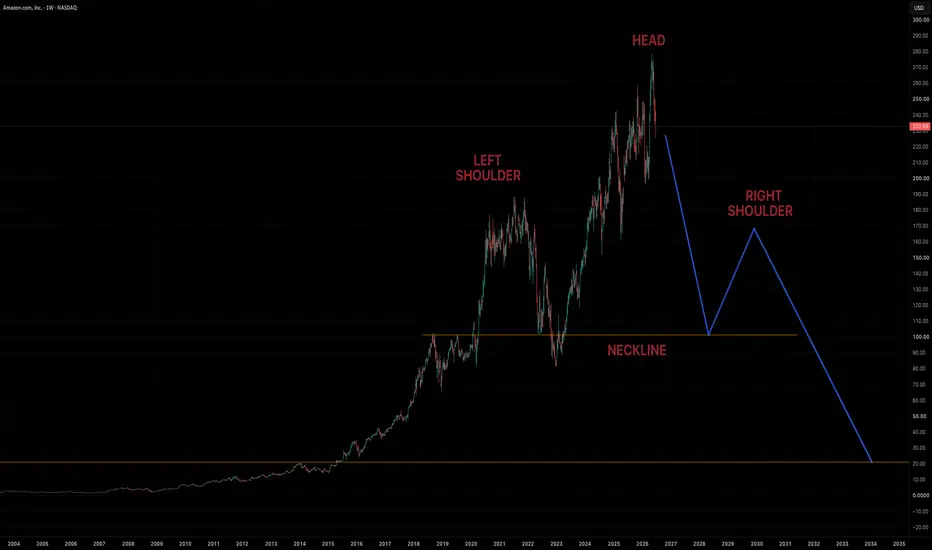
Amazon... potential macro Head & Shoulders pattern setup. This crash is gonna get ugly...
U.S. stock market valuation indicators:
Buffett Indicator: 2026: ~236% (2000 peak: ~145%; 2008 peak: ~110%)
Price-to-Sales: 2026: ~3.6x (2000 peak: ~2.1x; 2008 peak: ~1.5x)
Profit Margins: 2026: ~13.4% (2000 peak: ~8%; 2008 peak: ~7%)
Price-to-Book: 2026: ~5.8x (2000 peak: ~5x; 2008 peak: ~3x)
U.S. stock market valuation indicators:
Buffett Indicator: 2026: ~236% (2000 peak: ~145%; 2008 peak: ~110%)
Price-to-Sales: 2026: ~3.6x (2000 peak: ~2.1x; 2008 peak: ~1.5x)
Profit Margins: 2026: ~13.4% (2000 peak: ~8%; 2008 peak: ~7%)
Price-to-Book: 2026: ~5.8x (2000 peak: ~5x; 2008 peak: ~3x)

Disclaimer
The information and publications are not meant to be, and do not constitute, financial, investment, trading, or other types of advice or recommendations supplied or endorsed by TradingView. Read more in the Terms of Use.
Disclaimer
The information and publications are not meant to be, and do not constitute, financial, investment, trading, or other types of advice or recommendations supplied or endorsed by TradingView. Read more in the Terms of Use.