
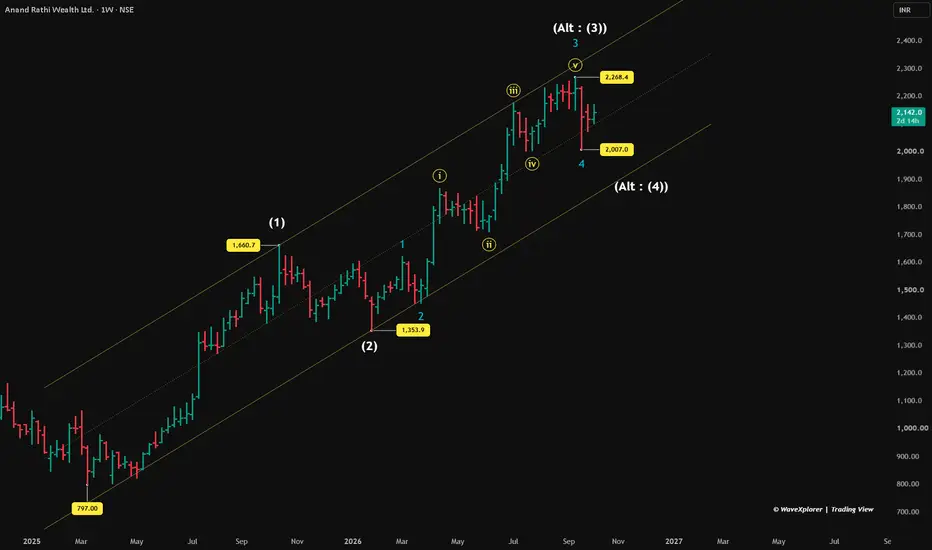
From the March 2025 low of 797, this stock has almost tripled. The move fits a clean Elliott Wave structure.
Wave (1) and (2): Wave (1) ran from 797 to 1,660.7. Wave (2) fell to 1,353.9, taking back only 35.5% of wave (1). That's a shallow dip, which shows buyers stayed strong.
Wave (3) so far: Inside wave (3), wave 1 topped at 1,620.5 and wave 2 fell to 1,451.5. Wave 3 then ran to 2,268.4, about 3 times the size of wave 1, in five smaller waves: ⓘ to ⓥ. Wave 4 ended at 2,007.
Why the count looks right:
Main view: Wave 5 of (3) may be starting from 2,007. Fibonacci measurements point to the 2,450–2,570 zone as the area where wave (3) could complete.
Alternate view: Wave (3) may already be done at 2,268.4. In that case, a bigger wave (4) could take price toward 1,920 first, and it must stay above 1,660.7.
I'll update this as the structure develops.
Educational wave study only. Not a buy or sell recommendation.
Disclaimer:
I am not a SEBI registered research analyst. This post is shared only for education and learning purposes, based on my personal reading of the chart. It is not a buy or sell recommendation. Please do your own research or speak to a registered advisor before taking any trading decision.
Wave (1) and (2): Wave (1) ran from 797 to 1,660.7. Wave (2) fell to 1,353.9, taking back only 35.5% of wave (1). That's a shallow dip, which shows buyers stayed strong.
Wave (3) so far: Inside wave (3), wave 1 topped at 1,620.5 and wave 2 fell to 1,451.5. Wave 3 then ran to 2,268.4, about 3 times the size of wave 1, in five smaller waves: ⓘ to ⓥ. Wave 4 ended at 2,007.
Why the count looks right:
- All three Elliott rules hold. Wave 2 stayed above the start of wave 1, wave 3 is not the shortest, and wave 4 stayed well above wave 1.
- Wave 2 was deep (63%) and wave 4 was shallow (32%). This is the alternation the theory expects.
- Wave 4 stopped at 2,007, almost exactly where the smaller wave ⓘⓥ ended (2,003). That's a textbook spot.
- Price touched the upper channel line but has not broken above it. That suggests wave (3) may still have one more leg.
Main view: Wave 5 of (3) may be starting from 2,007. Fibonacci measurements point to the 2,450–2,570 zone as the area where wave (3) could complete.
Alternate view: Wave (3) may already be done at 2,268.4. In that case, a bigger wave (4) could take price toward 1,920 first, and it must stay above 1,660.7.
I'll update this as the structure develops.
Educational wave study only. Not a buy or sell recommendation.
Disclaimer:
I am not a SEBI registered research analyst. This post is shared only for education and learning purposes, based on my personal reading of the chart. It is not a buy or sell recommendation. Please do your own research or speak to a registered advisor before taking any trading decision.

WaveXplorer | Elliott Wave insights
📊 X profile: @veerappa89
📊 X profile: @veerappa89
Related publications
Disclaimer
The information and publications are not meant to be, and do not constitute, financial, investment, trading, or other types of advice or recommendations supplied or endorsed by TradingView. Read more in the Terms of Use.
WaveXplorer | Elliott Wave insights
📊 X profile: @veerappa89
📊 X profile: @veerappa89
Related publications
Disclaimer
The information and publications are not meant to be, and do not constitute, financial, investment, trading, or other types of advice or recommendations supplied or endorsed by TradingView. Read more in the Terms of Use.