
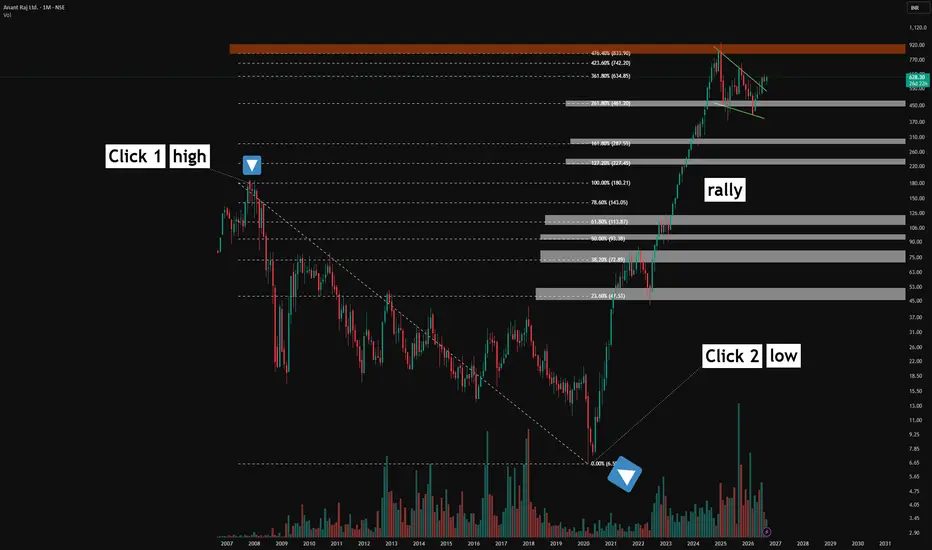
All price action shown in this chart is historical and older than three months. This post is purely educational and observational in nature. It is not a forecast or a trading recommendation.
Setting Up the Fibonacci Tool
To build this study, the Fibonacci tool was anchored using two clicks on the monthly timeframe. The first click, marked as Click 1, was placed at the swing high. The second click, marked as Click 2, was placed at the swing low, capturing the full downtrend that unfolded on this chart from 2007 to 2020.
Understanding the Levels
Once anchored, the tool generates a series of levels. Everything between 0% and 100%, including 23.6%, 38.2%, 50%, 61.8%, and 78.6%, are the standard retracement levels, commonly used to measure pullbacks within a move. Everything beyond 100%, including 127.2%, 161.8%, 261.8%, 361.8%, 423.6%, and 476.4%, are known as extension levels. These project price targets beyond the original swing, offering reference points the market has not yet reached at the time the tool is drawn.
The White Zones and the Red Zone
Marked on this chart are seven to eight white zones, along with one red zone at the very top. Each of these zones represents an area where the market, on the monthly timeframe, either reacted strongly (forming a full rejection candle for that month) or entered a period of consolidation around that exact level. In some instances, price found support at these zones later on, while in others it consolidated between them. This in between space is referred to here as air, the room the market moves through between one respected extension level and the next.
What the Chart Reveals
Across twelve total extension labels plotted on this chart, the vast majority were respected by price at some point across this multi decade downtrend, either through direct reaction or through consolidation nearby. Not every single level held with equal precision, and that itself is an important data point. Fibonacci extensions are not meant to work with perfect consistency at every level, but when the overwhelming majority of levels show some form of respected reaction across such a long stretch of price history, it becomes a compelling study in how far these mathematically derived levels can extend their relevance.
The Bigger Picture
This chart is a rare, extended look at how Fibonacci extension levels can play out not just once, but repeatedly, across more than a decade of price history. Learning to identify these zones, understanding the difference between standard retracement levels and true extensions, and observing how price interacts with them over the long run is a valuable addition to any trader's technical toolkit.
Setting Up the Fibonacci Tool
To build this study, the Fibonacci tool was anchored using two clicks on the monthly timeframe. The first click, marked as Click 1, was placed at the swing high. The second click, marked as Click 2, was placed at the swing low, capturing the full downtrend that unfolded on this chart from 2007 to 2020.
Understanding the Levels
Once anchored, the tool generates a series of levels. Everything between 0% and 100%, including 23.6%, 38.2%, 50%, 61.8%, and 78.6%, are the standard retracement levels, commonly used to measure pullbacks within a move. Everything beyond 100%, including 127.2%, 161.8%, 261.8%, 361.8%, 423.6%, and 476.4%, are known as extension levels. These project price targets beyond the original swing, offering reference points the market has not yet reached at the time the tool is drawn.
The White Zones and the Red Zone
Marked on this chart are seven to eight white zones, along with one red zone at the very top. Each of these zones represents an area where the market, on the monthly timeframe, either reacted strongly (forming a full rejection candle for that month) or entered a period of consolidation around that exact level. In some instances, price found support at these zones later on, while in others it consolidated between them. This in between space is referred to here as air, the room the market moves through between one respected extension level and the next.
What the Chart Reveals
Across twelve total extension labels plotted on this chart, the vast majority were respected by price at some point across this multi decade downtrend, either through direct reaction or through consolidation nearby. Not every single level held with equal precision, and that itself is an important data point. Fibonacci extensions are not meant to work with perfect consistency at every level, but when the overwhelming majority of levels show some form of respected reaction across such a long stretch of price history, it becomes a compelling study in how far these mathematically derived levels can extend their relevance.
The Bigger Picture
This chart is a rare, extended look at how Fibonacci extension levels can play out not just once, but repeatedly, across more than a decade of price history. Learning to identify these zones, understanding the difference between standard retracement levels and true extensions, and observing how price interacts with them over the long run is a valuable addition to any trader's technical toolkit.

📊Swing & positional research with Buy, Sell & Hold recommendations
Contact for NOVEMBER SLOTS
📞WhatsApp ( Pro ): wa.me/919455664601
📢Free Picks on Telegram ( Join ) : t.me/hashtaghammer
Apoorv Dubey|SEBI RA INH000030287
Contact for NOVEMBER SLOTS
📞WhatsApp ( Pro ): wa.me/919455664601
📢Free Picks on Telegram ( Join ) : t.me/hashtaghammer
Apoorv Dubey|SEBI RA INH000030287
Related publications
Disclaimer
The information and publications are not meant to be, and do not constitute, financial, investment, trading, or other types of advice or recommendations supplied or endorsed by TradingView. Read more in the Terms of Use.
📊Swing & positional research with Buy, Sell & Hold recommendations
Contact for NOVEMBER SLOTS
📞WhatsApp ( Pro ): wa.me/919455664601
📢Free Picks on Telegram ( Join ) : t.me/hashtaghammer
Apoorv Dubey|SEBI RA INH000030287
Contact for NOVEMBER SLOTS
📞WhatsApp ( Pro ): wa.me/919455664601
📢Free Picks on Telegram ( Join ) : t.me/hashtaghammer
Apoorv Dubey|SEBI RA INH000030287
Related publications
Disclaimer
The information and publications are not meant to be, and do not constitute, financial, investment, trading, or other types of advice or recommendations supplied or endorsed by TradingView. Read more in the Terms of Use.