
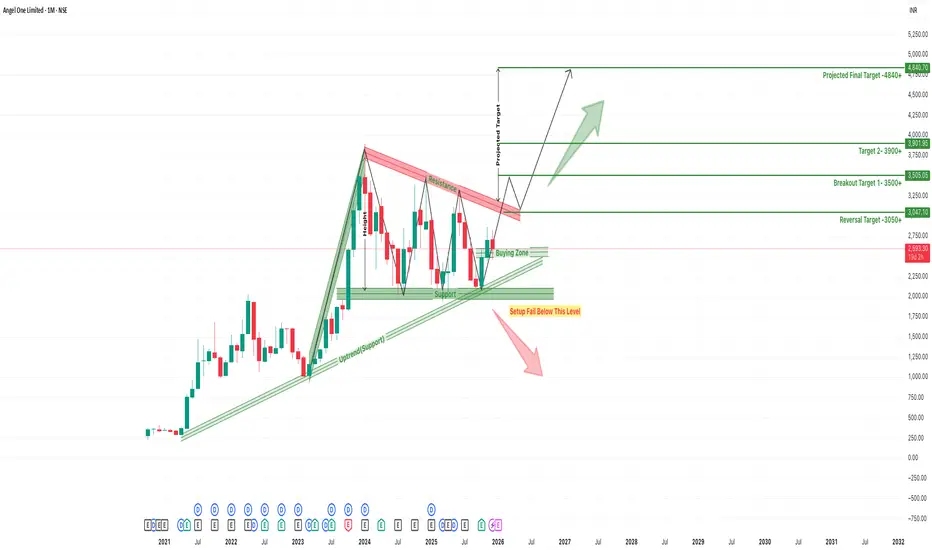
The monthly chart of Angel One shows a well-defined broadening wedge pattern, where price has been repeatedly oscillating between a rising support line and a widening resistance zone. The structure has been forming for almost two years, indicating a long consolidation phase after a strong uptrend. Currently, the price is trading near the lower trendline support, which aligns with the long-term uptrend support. This zone is marked as the Buying Zone, suggesting that the risk-reward ratio is favourable for long-term buyers as long as the support remains intact.
A potential breakout above the upper wedge resistance may trigger a strong upside rally. The first major level on the upside is the Reversal Target around 3050, which is the initial confirmation level. If price sustains above this, the momentum may carry it towards the Breakout Target near 3500, which represents the first official breakout swing. Once this level is surpassed, the trend may accelerate towards Target 2 around 3900, indicating continuation of the long-term bullish structure. The complete projected move from the pattern height signals a Final Projected Target around 4840, which is the long-term positional upside expectation.
On the downside, the setup remains valid only while the price trades above the lower trendline region. A sustained close below the marked failure level would invalidate the pattern, signalling potential weakness and a breakdown of the long-term bullish structure. However, until that failure zone is breached, the pattern continues to favour a bullish breakout scenario with upward projections as highlighted.
A potential breakout above the upper wedge resistance may trigger a strong upside rally. The first major level on the upside is the Reversal Target around 3050, which is the initial confirmation level. If price sustains above this, the momentum may carry it towards the Breakout Target near 3500, which represents the first official breakout swing. Once this level is surpassed, the trend may accelerate towards Target 2 around 3900, indicating continuation of the long-term bullish structure. The complete projected move from the pattern height signals a Final Projected Target around 4840, which is the long-term positional upside expectation.
On the downside, the setup remains valid only while the price trades above the lower trendline region. A sustained close below the marked failure level would invalidate the pattern, signalling potential weakness and a breakdown of the long-term bullish structure. However, until that failure zone is breached, the pattern continues to favour a bullish breakout scenario with upward projections as highlighted.

📈 Trade Smarter with TradZoo!
📣 Telegram: t.me/tradzooIndex
📣 Forex Telegram: t.me/tradzoofx
📲 Mobile App: tradzoo.com/download
📲 Forex App:tradzoo.com/forex/download
🔗 Website: bit.ly/tradzoopage
📣 Telegram: t.me/tradzooIndex
📣 Forex Telegram: t.me/tradzoofx
📲 Mobile App: tradzoo.com/download
📲 Forex App:tradzoo.com/forex/download
🔗 Website: bit.ly/tradzoopage
Disclaimer
The information and publications are not meant to be, and do not constitute, financial, investment, trading, or other types of advice or recommendations supplied or endorsed by TradingView. Read more in the Terms of Use.
📈 Trade Smarter with TradZoo!
📣 Telegram: t.me/tradzooIndex
📣 Forex Telegram: t.me/tradzoofx
📲 Mobile App: tradzoo.com/download
📲 Forex App:tradzoo.com/forex/download
🔗 Website: bit.ly/tradzoopage
📣 Telegram: t.me/tradzooIndex
📣 Forex Telegram: t.me/tradzoofx
📲 Mobile App: tradzoo.com/download
📲 Forex App:tradzoo.com/forex/download
🔗 Website: bit.ly/tradzoopage
Disclaimer
The information and publications are not meant to be, and do not constitute, financial, investment, trading, or other types of advice or recommendations supplied or endorsed by TradingView. Read more in the Terms of Use.