
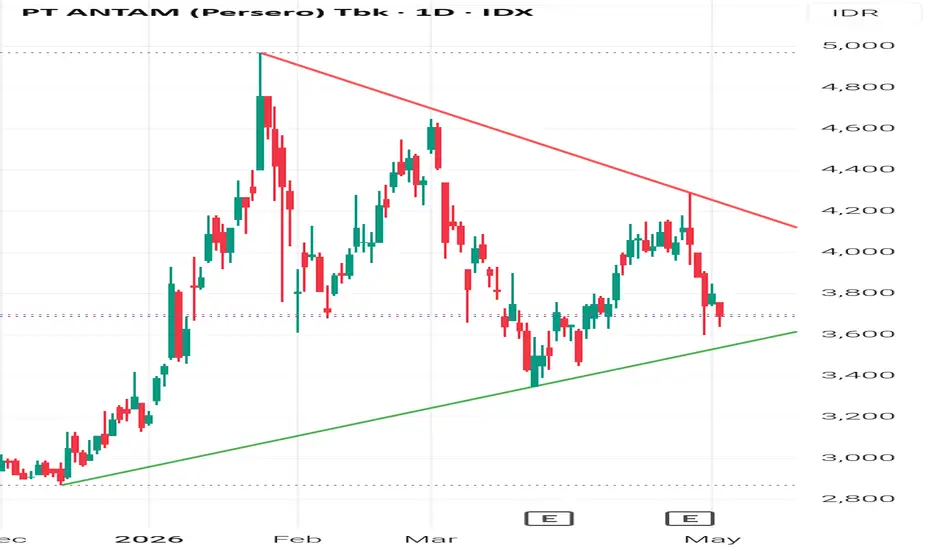
ANTM is currently forming a compression structure between a descending resistance (red trendline) and an ascending support (green trendline), indicating a potential symmetrical triangle pattern.
Price is now approaching the apex zone, which typically leads to a breakout move.
🔍 Key Observations:
Lower highs → bearish pressure from sellers
Higher lows → buyers still defending support
Price hovering around key horizontal level (~3,600–3,700)
Volatility is decreasing → breakout incoming
📈 Bullish Scenario:
Break and close above 4,100 – 4,200
Confirmation with strong bullish candle & volume
Potential targets: 4,400 → 4,700
📉 Bearish Scenario:
Breakdown below 3,600 support
Opens downside toward 3,300 → 3,000 area
⚠️ Strategy:
Wait for clear breakout + retest confirmation
Avoid entering inside the triangle (fakeout risk is high)
Use tight risk management
💡 Conclusion: ANTM is in a decision phase. A breakout from this structure will likely determine the next major trend direction.
Price is now approaching the apex zone, which typically leads to a breakout move.
🔍 Key Observations:
Lower highs → bearish pressure from sellers
Higher lows → buyers still defending support
Price hovering around key horizontal level (~3,600–3,700)
Volatility is decreasing → breakout incoming
📈 Bullish Scenario:
Break and close above 4,100 – 4,200
Confirmation with strong bullish candle & volume
Potential targets: 4,400 → 4,700
📉 Bearish Scenario:
Breakdown below 3,600 support
Opens downside toward 3,300 → 3,000 area
⚠️ Strategy:
Wait for clear breakout + retest confirmation
Avoid entering inside the triangle (fakeout risk is high)
Use tight risk management
💡 Conclusion: ANTM is in a decision phase. A breakout from this structure will likely determine the next major trend direction.

Disclaimer
The information and publications are not meant to be, and do not constitute, financial, investment, trading, or other types of advice or recommendations supplied or endorsed by TradingView. Read more in the Terms of Use.
Disclaimer
The information and publications are not meant to be, and do not constitute, financial, investment, trading, or other types of advice or recommendations supplied or endorsed by TradingView. Read more in the Terms of Use.