
All you need to know:
🟩 Support Levels (visible on the chart)
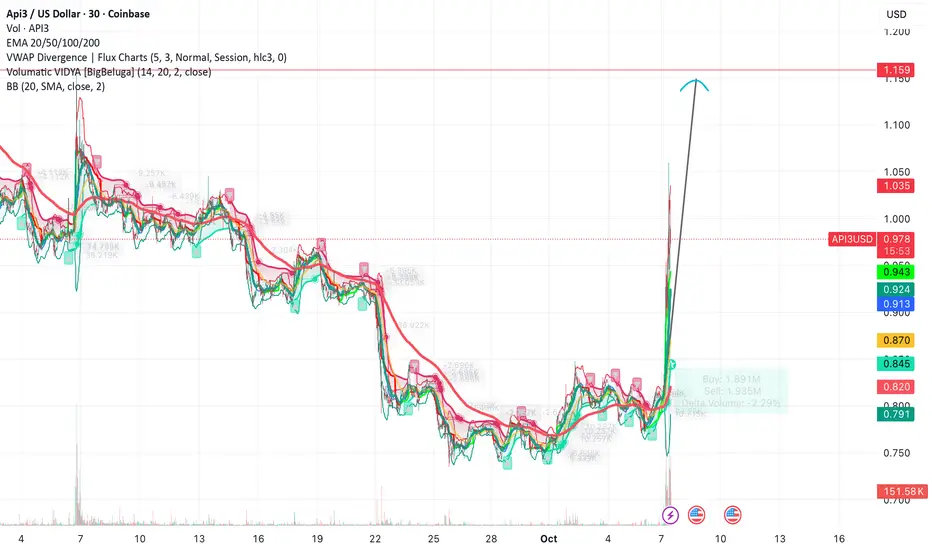
$0.791 — The lowest green EMA ribbon line at the bottom of the indicator cluster; this is a major support floor.
$0.820 – $0.871 — Multiple EMA levels (100/200) converge here, forming a strong support zone where price consolidated before the breakout.
$0.914 – $0.925 — Bollinger Band midline and EMA 50–20 cluster; acts as a short-term support area.
$0.943 — Labeled as VWAP Divergence (Flux Charts); current dynamic support after the breakout.
🟥 Resistance Levels (clearly marked on chart)
$1.037 — Marked horizontal red line labeled “BB 20 SMA close 2”; immediate overhead resistance.
$1.159 — The major resistance line shown in red near the top of the chart — likely the next key upside target (where the upward arrow points).
$1.200 (approx) — Slightly above the 1.159 mark; the top psychological zone visible on the price axis.
Currently a recent breakout upward move with a large green candle breaking above all moving averages and ribbons. Volume: 124.1K, confirming strong buying activity. EMA trend: Bullish crossover — all EMAs (20/50/100/200) are aligned upward.
⚙️ Visual Interpretation
The arrow drawn upward from $0.986 targets the $1.15–$1.16 resistance area, indicating bullish sentiment or an anticipated move toward that level.
If rejected near $1.037, price might retest supports near $0.94 or $0.92 before continuing higher.
✅ Summary from day chart
Immediate Support: $0.943 → $0.914 → $0.871
Immediate Resistance: $1.037 → $1.159
Short-term bullish momentum after strong breakout
Happy hunting!
🟩 Support Levels (visible on the chart)
$0.791 — The lowest green EMA ribbon line at the bottom of the indicator cluster; this is a major support floor.
$0.820 – $0.871 — Multiple EMA levels (100/200) converge here, forming a strong support zone where price consolidated before the breakout.
$0.914 – $0.925 — Bollinger Band midline and EMA 50–20 cluster; acts as a short-term support area.
$0.943 — Labeled as VWAP Divergence (Flux Charts); current dynamic support after the breakout.
🟥 Resistance Levels (clearly marked on chart)
$1.037 — Marked horizontal red line labeled “BB 20 SMA close 2”; immediate overhead resistance.
$1.159 — The major resistance line shown in red near the top of the chart — likely the next key upside target (where the upward arrow points).
$1.200 (approx) — Slightly above the 1.159 mark; the top psychological zone visible on the price axis.
Currently a recent breakout upward move with a large green candle breaking above all moving averages and ribbons. Volume: 124.1K, confirming strong buying activity. EMA trend: Bullish crossover — all EMAs (20/50/100/200) are aligned upward.
⚙️ Visual Interpretation
The arrow drawn upward from $0.986 targets the $1.15–$1.16 resistance area, indicating bullish sentiment or an anticipated move toward that level.
If rejected near $1.037, price might retest supports near $0.94 or $0.92 before continuing higher.
✅ Summary from day chart
Immediate Support: $0.943 → $0.914 → $0.871
Immediate Resistance: $1.037 → $1.159
Short-term bullish momentum after strong breakout
Happy hunting!

Disclaimer
The information and publications are not meant to be, and do not constitute, financial, investment, trading, or other types of advice or recommendations supplied or endorsed by TradingView. Read more in the Terms of Use.
Disclaimer
The information and publications are not meant to be, and do not constitute, financial, investment, trading, or other types of advice or recommendations supplied or endorsed by TradingView. Read more in the Terms of Use.