
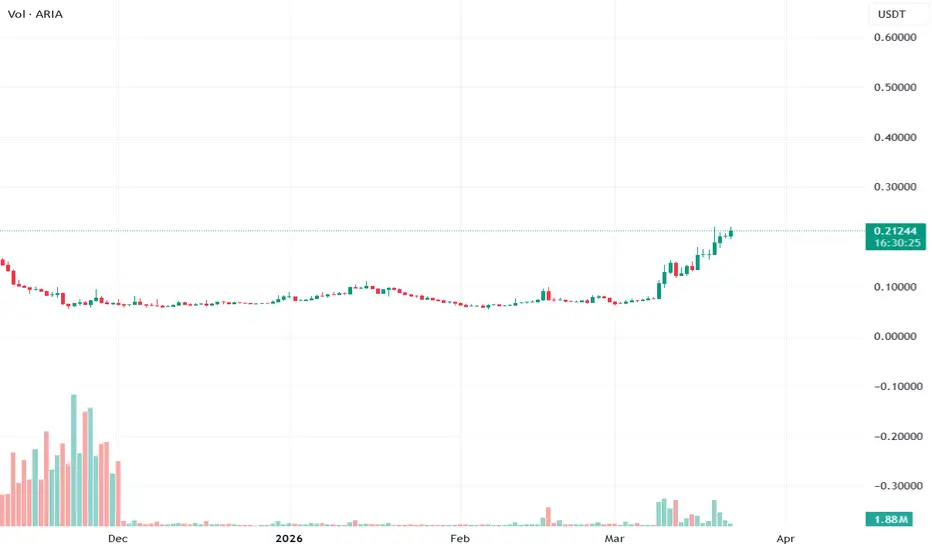
ARIAUSDT is printing 0.21169 spot against 0.21181 futures with futures volume running at 51.23M against a threadbare 3.37M on spot — a 15x imbalance generating 10.85M in futures dollar flow versus only 712.66K of real spot money. The Spot:Fut label reads Normal but a 15x raw ratio with under a million dollars of genuine spot participation means the entire parabolic structure visible in price was constructed and sustained by leveraged futures positioning rather than organic spot demand. Spread has already reached 41.2% Str and Bollinger Width is 142.36% Blowoff — volatility has fully expanded and the bands have blown out with no squeeze setup remaining to anchor a clean directional trade.
The signal board shows a constructive surface with structural cracks underneath. Total is 35:24 out of 112 for a Strong BULL bias at 41.22% and 2.4x confidence, clarity at 53%. EMA is 8:0 and Ichi TK is 8:5, providing solid trend alignment. Candle is 7:7 dead neutral and Engulf is 1:3 bearish. Star patterns are 2:3 and SS/DD is 1:1, both offering no directional conviction. Pat Tot is 4:3. C>T is 7:6, barely bullish. The retrace is only -4% Prime — virtually no pullback — against a parabolic bounce of 240.6% at 60.2x rated Para. This is one of the most extreme bounce readings in the dataset and it is being achieved with a minimal retracement, signaling that the move has had no healthy consolidation at any stage of its run.
Volume Z-scores are entirely quiet. Spot Z is -0.48 Steady, Futures Z is -0.39 Steady, and F+S Z is -0.36 Steady — every volume measure is below its statistical baseline. SpotZ 1:5 is -0.48 against -0.44 with a falling delta of -0.04 and a down arrow, meaning spot activity is decelerating even at these suppressed levels. Spot Momentum is Contracting Up at 394.3% Normal — directionally positive but shrinking fast. Bull:Bear Z is -0.25 against -0.50 reading Neutral, confirming neither side has real order flow conviction behind it. The parabolic price structure is floating on thin air with declining volume underneath it.
Price is at 92.1% of its historical range between 0.05867 and 0.2248 — sitting at Upper, near the absolute peak of what this asset has ever traded at. Leverage has declined from an all-time maximum of 62.6x recorded 70 bars ago to 15.23x now, sitting at the 24.3rd percentile Floor. The deleveraging from 62.6x to 15.23x has already happened, which removes the immediate liquidation cascade risk — but also means the fuel that drove the parabola has been systematically removed. AT Min is 0.0028x from 208 bars ago. Premium is 0.06% Neutral with yield at 62% APY on the bear side at -0.5 sigma — a mild funding cost to longs.
OBV Z is 0.24 with a confirmed Inflow trend — modest but the only genuine accumulation signal in the panel. OBV Divergence reads Normal with no bearish divergence, which at minimum confirms the move has not yet triggered distribution at the OBV level. No whale activity and no liquidation events are present. Squeeze is None across both spot and futures with divergence Normal.
The honest read: ARIAUSDT has printed a 60.2x parabolic bounce with a -4% Prime retrace, sitting at 92.1% of its all-time price range, sustained by a 15x futures-to-spot ratio on sub-million dollar real money. Every volume Z-score is below baseline, spot activity is falling, and Bollinger Width is already in Blowoff expansion — meaning the volatility event is already happening, not loading. There is no squeeze left to fire, no volume surge to validate continuation, and no spot accumulation to underpin the structure. The leverage deleveraging from 62.6x to 15.23x removes the cascade risk but also removes the marginal buyer. At price Upper with declining momentum and futures-only construction, this is a distribution zone until proven otherwise by a genuine spot volume reversal.
Is That Crypto Pump Real? Data Says No. Here's Why.
Stop Losing Money to Fake Volume. Find Real Moves Now.
Trade the REAL Crypto Volume. Stop Getting Faked Out.
The signal board shows a constructive surface with structural cracks underneath. Total is 35:24 out of 112 for a Strong BULL bias at 41.22% and 2.4x confidence, clarity at 53%. EMA is 8:0 and Ichi TK is 8:5, providing solid trend alignment. Candle is 7:7 dead neutral and Engulf is 1:3 bearish. Star patterns are 2:3 and SS/DD is 1:1, both offering no directional conviction. Pat Tot is 4:3. C>T is 7:6, barely bullish. The retrace is only -4% Prime — virtually no pullback — against a parabolic bounce of 240.6% at 60.2x rated Para. This is one of the most extreme bounce readings in the dataset and it is being achieved with a minimal retracement, signaling that the move has had no healthy consolidation at any stage of its run.
Volume Z-scores are entirely quiet. Spot Z is -0.48 Steady, Futures Z is -0.39 Steady, and F+S Z is -0.36 Steady — every volume measure is below its statistical baseline. SpotZ 1:5 is -0.48 against -0.44 with a falling delta of -0.04 and a down arrow, meaning spot activity is decelerating even at these suppressed levels. Spot Momentum is Contracting Up at 394.3% Normal — directionally positive but shrinking fast. Bull:Bear Z is -0.25 against -0.50 reading Neutral, confirming neither side has real order flow conviction behind it. The parabolic price structure is floating on thin air with declining volume underneath it.
Price is at 92.1% of its historical range between 0.05867 and 0.2248 — sitting at Upper, near the absolute peak of what this asset has ever traded at. Leverage has declined from an all-time maximum of 62.6x recorded 70 bars ago to 15.23x now, sitting at the 24.3rd percentile Floor. The deleveraging from 62.6x to 15.23x has already happened, which removes the immediate liquidation cascade risk — but also means the fuel that drove the parabola has been systematically removed. AT Min is 0.0028x from 208 bars ago. Premium is 0.06% Neutral with yield at 62% APY on the bear side at -0.5 sigma — a mild funding cost to longs.
OBV Z is 0.24 with a confirmed Inflow trend — modest but the only genuine accumulation signal in the panel. OBV Divergence reads Normal with no bearish divergence, which at minimum confirms the move has not yet triggered distribution at the OBV level. No whale activity and no liquidation events are present. Squeeze is None across both spot and futures with divergence Normal.
The honest read: ARIAUSDT has printed a 60.2x parabolic bounce with a -4% Prime retrace, sitting at 92.1% of its all-time price range, sustained by a 15x futures-to-spot ratio on sub-million dollar real money. Every volume Z-score is below baseline, spot activity is falling, and Bollinger Width is already in Blowoff expansion — meaning the volatility event is already happening, not loading. There is no squeeze left to fire, no volume surge to validate continuation, and no spot accumulation to underpin the structure. The leverage deleveraging from 62.6x to 15.23x removes the cascade risk but also removes the marginal buyer. At price Upper with declining momentum and futures-only construction, this is a distribution zone until proven otherwise by a genuine spot volume reversal.
Is That Crypto Pump Real? Data Says No. Here's Why.
Stop Losing Money to Fake Volume. Find Real Moves Now.
Trade the REAL Crypto Volume. Stop Getting Faked Out.

5 TradingView Premium Indicators : Real Volume. Real Signals. 3-day free trial 👇whop.com/volume-hunter/ tiktok.com/@volume_hunter t.me/volume_hunter Forex | Stocks | ETFs | Indices | Options
Disclaimer
The information and publications are not meant to be, and do not constitute, financial, investment, trading, or other types of advice or recommendations supplied or endorsed by TradingView. Read more in the Terms of Use.
5 TradingView Premium Indicators : Real Volume. Real Signals. 3-day free trial 👇whop.com/volume-hunter/ tiktok.com/@volume_hunter t.me/volume_hunter Forex | Stocks | ETFs | Indices | Options
Disclaimer
The information and publications are not meant to be, and do not constitute, financial, investment, trading, or other types of advice or recommendations supplied or endorsed by TradingView. Read more in the Terms of Use.