
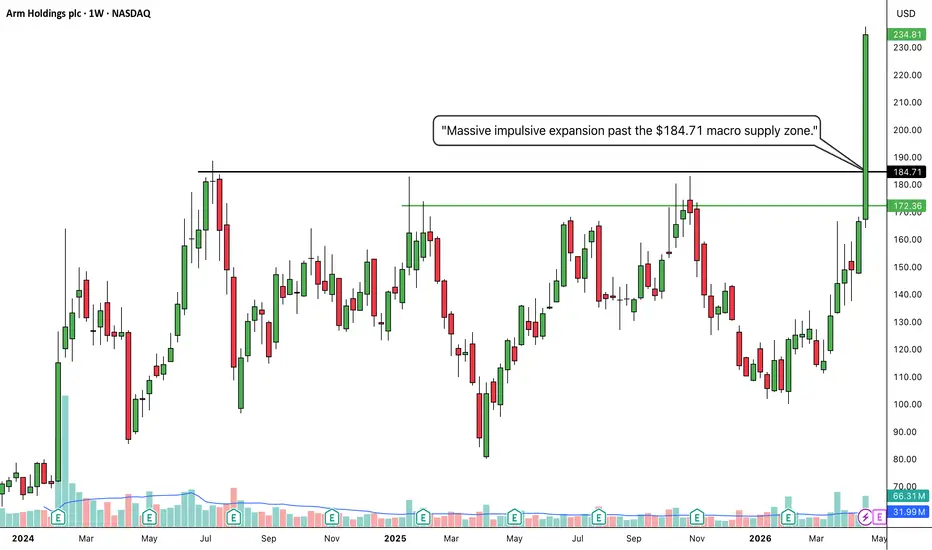
The Setup (Bias): I am taking a LONG bias on Arm Holdings plc (ARM) on the weekly timeframe.
The "Why" (Technical Reasons): 1. Major Range Breakout: After a massive, choppy consolidation period spanning back to mid-2024, the price has forcefully broken out of its range. It sliced cleanly through the heavy historical resistance ceiling at $184.71.
2. Extreme Bullish Momentum: The breakout is driven by a gigantic, full-bodied green weekly candle closing near its absolute highs. This type of impulsive, vertical price action indicates aggressive institutional buying and a complete absorption of any overhead supply.
Trade Plan (Entry & Exits): * Entry: Momentum traders can look for entries near the current extended market price of $234.81 to capture the aggressive surge. A safer, lower-risk approach would be waiting for the momentum to eventually cool off and placing limit orders to catch a potential pullback or retest of the $195.00 to $184.71 zone, letting the old ceiling prove itself as a new floor.
Take Profit (Target): With the stock breaking out into fresh blue skies with this much momentum, the next major psychological targets are $250.00, followed by $275.00.
Stop Loss: Placed safely below the green intermediate support line and the breakout origin, around $165.00. A weekly close back below the $184.71 structural level would be an early warning sign of a failed breakout.
Duration: Because this analysis is built on a 1-Week chart, this is a longer-term swing trade designed to play out over the coming weeks to months.
The "Why" (Technical Reasons): 1. Major Range Breakout: After a massive, choppy consolidation period spanning back to mid-2024, the price has forcefully broken out of its range. It sliced cleanly through the heavy historical resistance ceiling at $184.71.
2. Extreme Bullish Momentum: The breakout is driven by a gigantic, full-bodied green weekly candle closing near its absolute highs. This type of impulsive, vertical price action indicates aggressive institutional buying and a complete absorption of any overhead supply.
Trade Plan (Entry & Exits): * Entry: Momentum traders can look for entries near the current extended market price of $234.81 to capture the aggressive surge. A safer, lower-risk approach would be waiting for the momentum to eventually cool off and placing limit orders to catch a potential pullback or retest of the $195.00 to $184.71 zone, letting the old ceiling prove itself as a new floor.
Take Profit (Target): With the stock breaking out into fresh blue skies with this much momentum, the next major psychological targets are $250.00, followed by $275.00.
Stop Loss: Placed safely below the green intermediate support line and the breakout origin, around $165.00. A weekly close back below the $184.71 structural level would be an early warning sign of a failed breakout.
Duration: Because this analysis is built on a 1-Week chart, this is a longer-term swing trade designed to play out over the coming weeks to months.

Disclaimer
The information and publications are not meant to be, and do not constitute, financial, investment, trading, or other types of advice or recommendations supplied or endorsed by TradingView. Read more in the Terms of Use.
Disclaimer
The information and publications are not meant to be, and do not constitute, financial, investment, trading, or other types of advice or recommendations supplied or endorsed by TradingView. Read more in the Terms of Use.