
Educational Technical Analysis: Bullish Crab Pattern
1. Understanding Harmonic Patterns
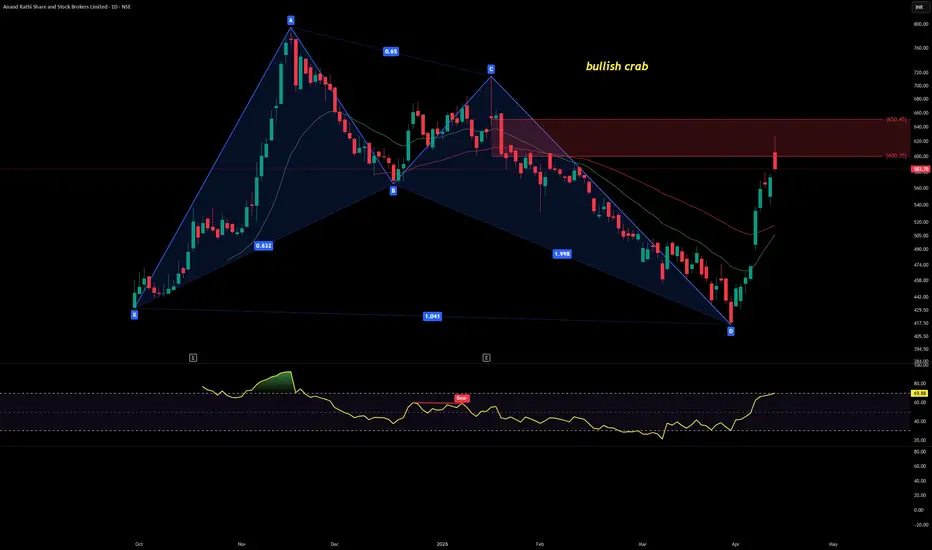
Harmonic patterns are advanced chart formations that use Fibonacci ratios to identify potential reversal zones. In this chart, we see a Bullish Crab pattern, which is known for its deep retracement and sharp reversal potential. The key points (X, A, B, C, D) form the structure, with ratios confirming the validity of the pattern:
XA retracement: Point B retraces ~65% of XA
BC retracement: Point C retraces ~65% of AB
CD extension: Point D extends ~200% of BC
Final confirmation: The overall structure aligns with the Crab’s geometry
This teaches traders how Fibonacci ratios are not random numbers but precise tools to validate harmonic setups.
2. The Potential Reversal Zone (PRZ)
The shaded red zone between ₹600–₹650 represents the PRZ. In harmonic trading, this is the area where price exhaustion is expected, and a reversal may occur.
Traders should not blindly buy at PRZ.
Instead, they wait for confirmation signals (candlestick reversal, volume spike, or momentum divergence).
This emphasizes the principle: Patterns suggest possibilities, not certainties.
3. RSI as a Supporting Indicator
The Relative Strength Index (RSI) is plotted below the chart, currently near 69.88.
RSI above 70 often signals overbought conditions.
Here, RSI is approaching that level, aligning with the PRZ resistance zone.
This confluence strengthens the educational takeaway: multiple tools should confirm a setup before acting.
4. Key Learning Points for Traders
Harmonic patterns like the Bullish Crab are powerful but require strict ratio validation.
The PRZ is a zone of interest, not a guaranteed reversal.
Always combine harmonic analysis with momentum indicators (like RSI) and price action signals.
Risk management is crucial: stop‑losses should be placed beyond the PRZ to protect against failed patterns.
5. Conclusion
This chart is a textbook example of how harmonics, Fibonacci ratios, and RSI can work together to highlight potential turning points. For learners, the main lesson is not just spotting the pattern, but understanding why it works and how to confirm it responsibly.
1. Understanding Harmonic Patterns
Harmonic patterns are advanced chart formations that use Fibonacci ratios to identify potential reversal zones. In this chart, we see a Bullish Crab pattern, which is known for its deep retracement and sharp reversal potential. The key points (X, A, B, C, D) form the structure, with ratios confirming the validity of the pattern:
XA retracement: Point B retraces ~65% of XA
BC retracement: Point C retraces ~65% of AB
CD extension: Point D extends ~200% of BC
Final confirmation: The overall structure aligns with the Crab’s geometry
This teaches traders how Fibonacci ratios are not random numbers but precise tools to validate harmonic setups.
2. The Potential Reversal Zone (PRZ)
The shaded red zone between ₹600–₹650 represents the PRZ. In harmonic trading, this is the area where price exhaustion is expected, and a reversal may occur.
Traders should not blindly buy at PRZ.
Instead, they wait for confirmation signals (candlestick reversal, volume spike, or momentum divergence).
This emphasizes the principle: Patterns suggest possibilities, not certainties.
3. RSI as a Supporting Indicator
The Relative Strength Index (RSI) is plotted below the chart, currently near 69.88.
RSI above 70 often signals overbought conditions.
Here, RSI is approaching that level, aligning with the PRZ resistance zone.
This confluence strengthens the educational takeaway: multiple tools should confirm a setup before acting.
4. Key Learning Points for Traders
Harmonic patterns like the Bullish Crab are powerful but require strict ratio validation.
The PRZ is a zone of interest, not a guaranteed reversal.
Always combine harmonic analysis with momentum indicators (like RSI) and price action signals.
Risk management is crucial: stop‑losses should be placed beyond the PRZ to protect against failed patterns.
5. Conclusion
This chart is a textbook example of how harmonics, Fibonacci ratios, and RSI can work together to highlight potential turning points. For learners, the main lesson is not just spotting the pattern, but understanding why it works and how to confirm it responsibly.

Sucrit.D.Patil
Disclaimer
The information and publications are not meant to be, and do not constitute, financial, investment, trading, or other types of advice or recommendations supplied or endorsed by TradingView. Read more in the Terms of Use.
Sucrit.D.Patil
Disclaimer
The information and publications are not meant to be, and do not constitute, financial, investment, trading, or other types of advice or recommendations supplied or endorsed by TradingView. Read more in the Terms of Use.