
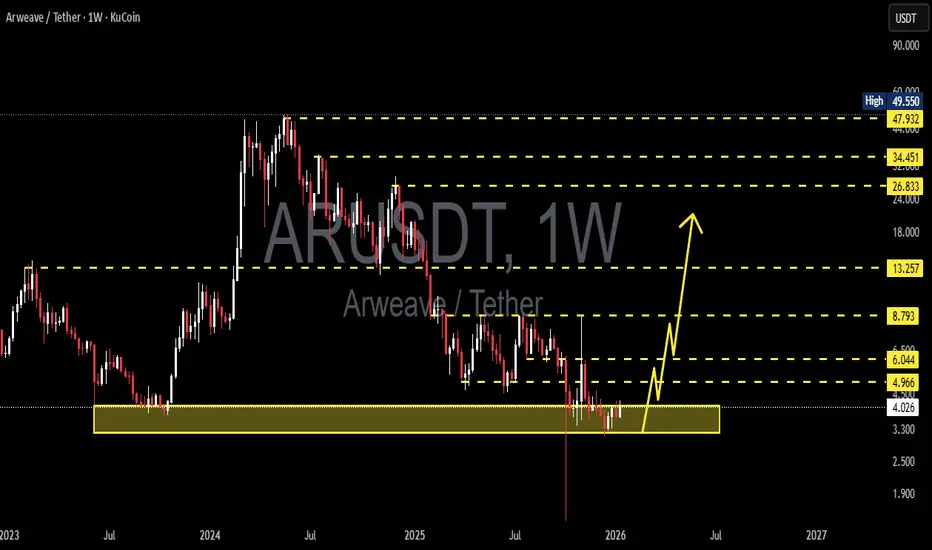
AR/USDT is currently trading on the Weekly (1W) timeframe and is testing a very critical historical demand zone at 4.03 – 3.20 USDT (highlighted by the yellow box). This area represents a previous accumulation base before a major bullish impulse, making it a highly significant technical level.
After failing to maintain its mid-term bullish structure, price has formed a clear downtrend (lower highs – lower lows) and is now approaching a long-term decision point.
---
Key Levels
Major Support (Demand Zone):
4.03 – 3.20 USDT → Strong historical demand & accumulation zone
Resistance / Layered Supply Zones:
4.96 – 6.04 USDT → Minor resistance / pullback zone
8.79 USDT → Previous breakdown support
13.25 USDT → Weekly key resistance
26.83 USDT → Mid-cycle resistance
34.45 USDT → Major supply zone
47.93 – 49.55 USDT → Macro top resistance
---
Pattern & Market Structure Explanation
Primary Trend: Bearish (Lower High & Lower Low)
Market Phase: Late downtrend / potential accumulation
Observed Pattern:
Falling structure into a major demand zone
Indication of potential Wyckoff Accumulation Phase A–B, if price holds above demand
Candle Behavior:
Strong rejection wicks below demand indicate early buyer interest
However, there is no confirmed weekly bullish reversal candle yet
---
Bullish Scenario
The bullish scenario is valid only if:
1. Price holds above 3.20 USDT
2. A weekly higher low is formed
3. Strong break and weekly close above 4.96 – 6.04 USDT
Bullish Step-by-Step Targets:
6.04 USDT → Initial reversal validation
8.79 USDT → Key resistance
13.25 USDT → Trend reversal confirmation
26.83 USDT → Mid-cycle bullish expansion
34.45 USDT → Major distribution zone
This bullish bias represents a long-term accumulation opportunity, not a short-term scalp setup.
---
Bearish Scenario
The bearish scenario occurs if:
1. A valid weekly close below 3.20 USDT
2. The demand zone fails to absorb selling pressure
3. There is no impulsive bullish reaction from the yellow zone
Bearish Implications:
Demand breakdown → downside price discovery
Potential continuation targets:
2.50 USDT
1.90 USDT
Possible retest of the all-time base
In this case, the structure shifts into a macro bearish continuation, not merely a correction.
---
Conclusion
The 4.03 – 3.20 USDT zone is a make-or-break level for AR/USDT’s long-term structure.
Holding and reclaiming resistance → potential major trend reversal
Weekly breakdown below demand → bearish continuation
Price is currently in a decision zone, not an area for aggressive entries without confirmation.
#ARUSDT #Arweave #CryptoAnalysis #TechnicalAnalysis #WeeklyChart #DemandZone #SupportResistance #MarketStructure #TrendReversal #LongTermSetup
After failing to maintain its mid-term bullish structure, price has formed a clear downtrend (lower highs – lower lows) and is now approaching a long-term decision point.
---
Key Levels
Major Support (Demand Zone):
4.03 – 3.20 USDT → Strong historical demand & accumulation zone
Resistance / Layered Supply Zones:
4.96 – 6.04 USDT → Minor resistance / pullback zone
8.79 USDT → Previous breakdown support
13.25 USDT → Weekly key resistance
26.83 USDT → Mid-cycle resistance
34.45 USDT → Major supply zone
47.93 – 49.55 USDT → Macro top resistance
---
Pattern & Market Structure Explanation
Primary Trend: Bearish (Lower High & Lower Low)
Market Phase: Late downtrend / potential accumulation
Observed Pattern:
Falling structure into a major demand zone
Indication of potential Wyckoff Accumulation Phase A–B, if price holds above demand
Candle Behavior:
Strong rejection wicks below demand indicate early buyer interest
However, there is no confirmed weekly bullish reversal candle yet
---
Bullish Scenario
The bullish scenario is valid only if:
1. Price holds above 3.20 USDT
2. A weekly higher low is formed
3. Strong break and weekly close above 4.96 – 6.04 USDT
Bullish Step-by-Step Targets:
6.04 USDT → Initial reversal validation
8.79 USDT → Key resistance
13.25 USDT → Trend reversal confirmation
26.83 USDT → Mid-cycle bullish expansion
34.45 USDT → Major distribution zone
This bullish bias represents a long-term accumulation opportunity, not a short-term scalp setup.
---
Bearish Scenario
The bearish scenario occurs if:
1. A valid weekly close below 3.20 USDT
2. The demand zone fails to absorb selling pressure
3. There is no impulsive bullish reaction from the yellow zone
Bearish Implications:
Demand breakdown → downside price discovery
Potential continuation targets:
2.50 USDT
1.90 USDT
Possible retest of the all-time base
In this case, the structure shifts into a macro bearish continuation, not merely a correction.
---
Conclusion
The 4.03 – 3.20 USDT zone is a make-or-break level for AR/USDT’s long-term structure.
Holding and reclaiming resistance → potential major trend reversal
Weekly breakdown below demand → bearish continuation
Price is currently in a decision zone, not an area for aggressive entries without confirmation.
#ARUSDT #Arweave #CryptoAnalysis #TechnicalAnalysis #WeeklyChart #DemandZone #SupportResistance #MarketStructure #TrendReversal #LongTermSetup

✅ Get Free Signals! Join Our Telegram Channel Here: t.me/TheCryptoNuclear
✅ Twitter: twitter.com/crypto_nuclear
✅ Join Bybit : partner.bybit.com/b/nuclearvip
✅ Benefits : Lifetime Trading Fee Discount -50%
✅ Twitter: twitter.com/crypto_nuclear
✅ Join Bybit : partner.bybit.com/b/nuclearvip
✅ Benefits : Lifetime Trading Fee Discount -50%
Disclaimer
The information and publications are not meant to be, and do not constitute, financial, investment, trading, or other types of advice or recommendations supplied or endorsed by TradingView. Read more in the Terms of Use.
✅ Get Free Signals! Join Our Telegram Channel Here: t.me/TheCryptoNuclear
✅ Twitter: twitter.com/crypto_nuclear
✅ Join Bybit : partner.bybit.com/b/nuclearvip
✅ Benefits : Lifetime Trading Fee Discount -50%
✅ Twitter: twitter.com/crypto_nuclear
✅ Join Bybit : partner.bybit.com/b/nuclearvip
✅ Benefits : Lifetime Trading Fee Discount -50%
Disclaimer
The information and publications are not meant to be, and do not constitute, financial, investment, trading, or other types of advice or recommendations supplied or endorsed by TradingView. Read more in the Terms of Use.