
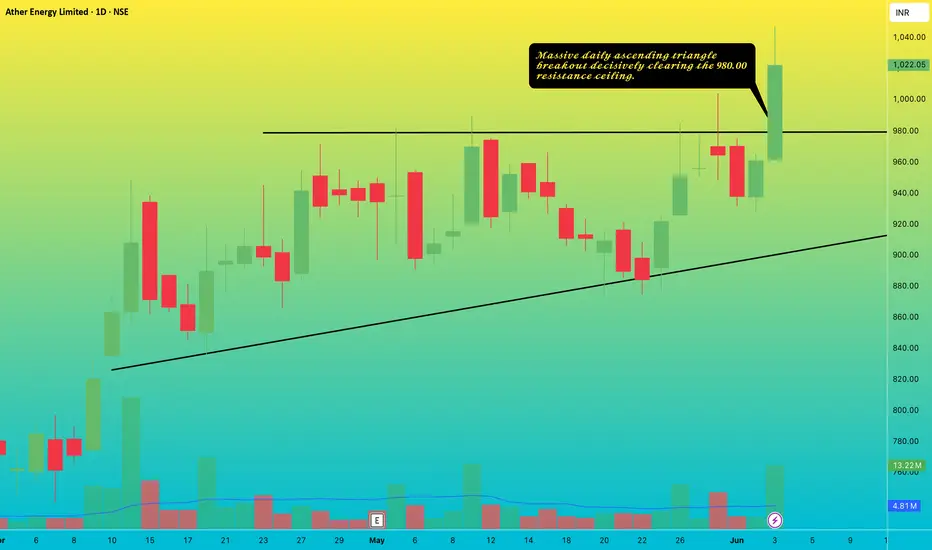
1. The Macro Perspective: The Ascending Triangle Formation
I am taking a LONG bias on Ather Energy Limited (ATHERENERG) on the daily (1D) timeframe.
When analyzing pure market structure on an EV sector leader, consolidation patterns like the Ascending Triangle are essential to absorb supply and build kinetic energy. Following a steady climb, the stock entered a multi-week digestion phase, carving out a textbook Ascending Triangle visible on the chart. This phase allowed institutional capital to systematically accumulate shares at steadily increasing valuations.
2. The Educational Setup: Horizontal Resistance & Dynamic Support
To understand the technical validity behind this macro launch, look closely at how the price structure interacted with its core boundaries:
The 980.00 Resistance Ceiling: The definitive line in the sand for a bullish structural breakout was the solid black horizontal resistance line drawn at 980.00. This level acted as a heavy supply zone that systematically rejected multiple breakout attempts throughout May.
The Ascending Trendline (Support): During the consolidation, buyers aggressively defended the structural floors, forming a solid ascending diagonal trendline. Every pullback was bought at a higher low, squeezing volatility directly beneath the 980.00 breakout zone and building immense kinetic energy.
3. Current Price Action: Breakout and Volatility Expansion
Look at the massive daily candle on the far right of the chart. The structural pressure cooker has officially exploded. Institutional buyers have stepped in with undeniable conviction, backed by a noticeable volume expansion. The stock printed a towering, full-bodied green candle that has vertically surged to close near 1,022.05. This explosive thrust has decisively obliterated the 980.00 ceiling. The stock has officially transitioned out of its accumulation base and back into a highly explosive markup trend into fresh price discovery territory.
Note: Always ensure the exchange's End of Day (EOD) data files have fully synchronized before confirming the final daily close shape. It is best practice to wait until after 9:00 PM to account for any delayed Indian market data synchronization, ensuring there are no visual discrepancies or data glitches before submitting final updates for management review.
4. The Trade Plan: Entries, Targets, and Risk Management
Entry Strategy: Momentum is exceptionally strong with the stock trading vertically out in the open above the breakout line. Chasing an extended daily breakout candle carries a minor risk of a short-term mean-reversion pullback. The highest-probability entry strategy involves waiting for the initial vertical excitement to cool off. Look to scale into long positions on a potential structural pullback that perfectly retests the broken 975.00 to 985.00 prior resistance zone. Letting old historical resistance prove itself as a concrete new support floor provides an unmatched risk-to-reward ratio.
Take Profit (Targets): We use a classical measured move strategy. By taking the depth of the triangle's base (roughly 150 points from the lowest structural touch near 830.00 up to the 980.00 resistance) and projecting it upward from the breakout point, our primary structural target sits comfortably in the 1,120.00 to 1,130.00 zone over the coming weeks.
Invalidation (Stop Loss): An explosive breakout thesis is completely invalidated if the price fails to hold its newly claimed structural floor and collapses back inside the core of the triangle boundary. A hard stop loss should be placed safely below the ascending trendline and recent swing lows, specifically around the 920.00 to 930.00 level. A definitive daily close completely back below 920.00 would act as a severe warning sign of a failed continuation breakout and a bull trap.
5. Time Horizon:
Because this technical setup is built on a 1-Day chart capturing a clear structural phase transition and a textbook ascending triangle breakout, this is a high-alpha swing trade designed to capture a rapid momentum markup phase over the coming weeks. Let the trend run!
I am taking a LONG bias on Ather Energy Limited (ATHERENERG) on the daily (1D) timeframe.
When analyzing pure market structure on an EV sector leader, consolidation patterns like the Ascending Triangle are essential to absorb supply and build kinetic energy. Following a steady climb, the stock entered a multi-week digestion phase, carving out a textbook Ascending Triangle visible on the chart. This phase allowed institutional capital to systematically accumulate shares at steadily increasing valuations.
2. The Educational Setup: Horizontal Resistance & Dynamic Support
To understand the technical validity behind this macro launch, look closely at how the price structure interacted with its core boundaries:
The 980.00 Resistance Ceiling: The definitive line in the sand for a bullish structural breakout was the solid black horizontal resistance line drawn at 980.00. This level acted as a heavy supply zone that systematically rejected multiple breakout attempts throughout May.
The Ascending Trendline (Support): During the consolidation, buyers aggressively defended the structural floors, forming a solid ascending diagonal trendline. Every pullback was bought at a higher low, squeezing volatility directly beneath the 980.00 breakout zone and building immense kinetic energy.
3. Current Price Action: Breakout and Volatility Expansion
Look at the massive daily candle on the far right of the chart. The structural pressure cooker has officially exploded. Institutional buyers have stepped in with undeniable conviction, backed by a noticeable volume expansion. The stock printed a towering, full-bodied green candle that has vertically surged to close near 1,022.05. This explosive thrust has decisively obliterated the 980.00 ceiling. The stock has officially transitioned out of its accumulation base and back into a highly explosive markup trend into fresh price discovery territory.
Note: Always ensure the exchange's End of Day (EOD) data files have fully synchronized before confirming the final daily close shape. It is best practice to wait until after 9:00 PM to account for any delayed Indian market data synchronization, ensuring there are no visual discrepancies or data glitches before submitting final updates for management review.
4. The Trade Plan: Entries, Targets, and Risk Management
Entry Strategy: Momentum is exceptionally strong with the stock trading vertically out in the open above the breakout line. Chasing an extended daily breakout candle carries a minor risk of a short-term mean-reversion pullback. The highest-probability entry strategy involves waiting for the initial vertical excitement to cool off. Look to scale into long positions on a potential structural pullback that perfectly retests the broken 975.00 to 985.00 prior resistance zone. Letting old historical resistance prove itself as a concrete new support floor provides an unmatched risk-to-reward ratio.
Take Profit (Targets): We use a classical measured move strategy. By taking the depth of the triangle's base (roughly 150 points from the lowest structural touch near 830.00 up to the 980.00 resistance) and projecting it upward from the breakout point, our primary structural target sits comfortably in the 1,120.00 to 1,130.00 zone over the coming weeks.
Invalidation (Stop Loss): An explosive breakout thesis is completely invalidated if the price fails to hold its newly claimed structural floor and collapses back inside the core of the triangle boundary. A hard stop loss should be placed safely below the ascending trendline and recent swing lows, specifically around the 920.00 to 930.00 level. A definitive daily close completely back below 920.00 would act as a severe warning sign of a failed continuation breakout and a bull trap.
5. Time Horizon:
Because this technical setup is built on a 1-Day chart capturing a clear structural phase transition and a textbook ascending triangle breakout, this is a high-alpha swing trade designed to capture a rapid momentum markup phase over the coming weeks. Let the trend run!
Trade closed: target reached
Price reached a fresh all time high of 1143. 
Disclaimer
The information and publications are not meant to be, and do not constitute, financial, investment, trading, or other types of advice or recommendations supplied or endorsed by TradingView. Read more in the Terms of Use.
Disclaimer
The information and publications are not meant to be, and do not constitute, financial, investment, trading, or other types of advice or recommendations supplied or endorsed by TradingView. Read more in the Terms of Use.