

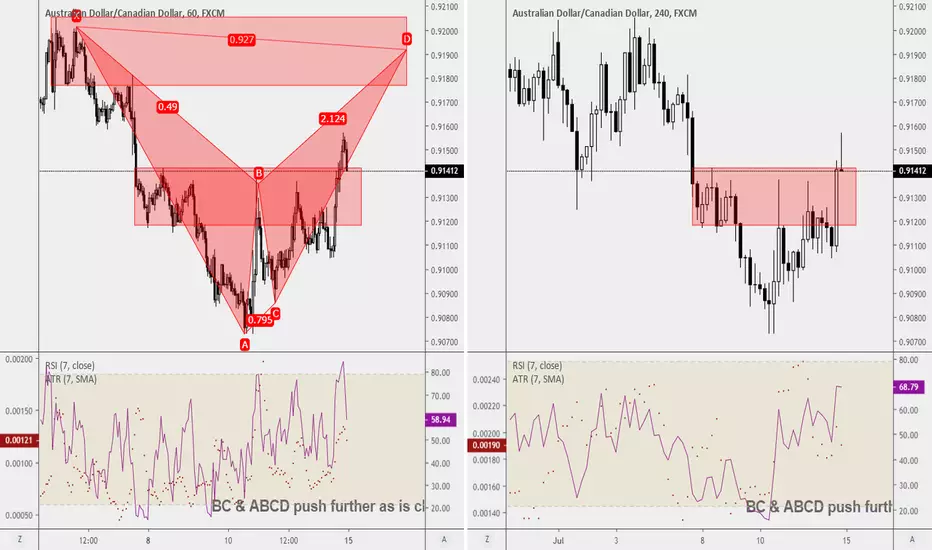
You can see how nicely the 4-hourly chart(right) close within the sell zone although the 1-hourly chart(left) said otherwise.
On the 1-hourly chart, the bat pattern forms at 0.9192 for a shorting opportunity should the market extend further.
On the 1-hourly chart, the bat pattern forms at 0.9192 for a shorting opportunity should the market extend further.

🧑🏫Analysis now at Substack
🕒 Work 15mins to earn additional income
🏦 Qualify Financial Analyst within 90days
🎤 Keynote Speaker
🧠 21yrs in trading
🚀 Get into our Discord to receive our live market analysis!
discord.gg/AKDr9vPqH7
🕒 Work 15mins to earn additional income
🏦 Qualify Financial Analyst within 90days
🎤 Keynote Speaker
🧠 21yrs in trading
🚀 Get into our Discord to receive our live market analysis!
discord.gg/AKDr9vPqH7
Disclaimer
The information and publications are not meant to be, and do not constitute, financial, investment, trading, or other types of advice or recommendations supplied or endorsed by TradingView. Read more in the Terms of Use.
🧑🏫Analysis now at Substack
🕒 Work 15mins to earn additional income
🏦 Qualify Financial Analyst within 90days
🎤 Keynote Speaker
🧠 21yrs in trading
🚀 Get into our Discord to receive our live market analysis!
discord.gg/AKDr9vPqH7
🕒 Work 15mins to earn additional income
🏦 Qualify Financial Analyst within 90days
🎤 Keynote Speaker
🧠 21yrs in trading
🚀 Get into our Discord to receive our live market analysis!
discord.gg/AKDr9vPqH7
Disclaimer
The information and publications are not meant to be, and do not constitute, financial, investment, trading, or other types of advice or recommendations supplied or endorsed by TradingView. Read more in the Terms of Use.