

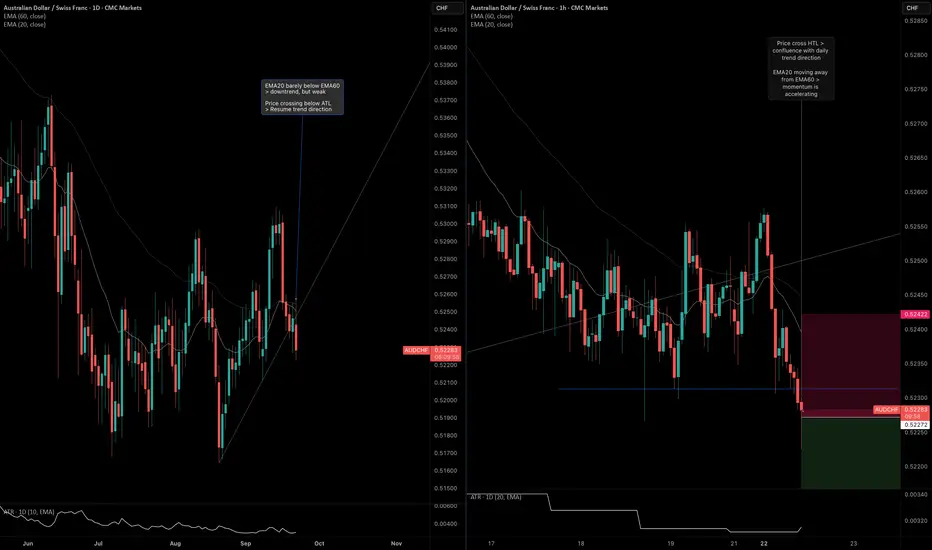
Momentum is beginning to pick up on the AUDCHF pair. This is based on the EMA behavior along with price's behavior around the ATLs plotted. Here are my observations across two key timeframes.
Daily Timeframe:
H1 Timeframe:
Daily Timeframe:
- Price crosses below ATL > first indication of momentum picking up
- EMA20 is beginning to move away from EMA60 > second indication of momentum
H1 Timeframe:
- EMA20 diverges away from EMA60 > indication of momentum
- Price crosses below intraday HTL > confluence with overall downtrend if there isn't a liquidity trap

Disclaimer
The information and publications are not meant to be, and do not constitute, financial, investment, trading, or other types of advice or recommendations supplied or endorsed by TradingView. Read more in the Terms of Use.
Disclaimer
The information and publications are not meant to be, and do not constitute, financial, investment, trading, or other types of advice or recommendations supplied or endorsed by TradingView. Read more in the Terms of Use.