

📌 Overview
___________________________________________________________
📘 Definition
___________________________________________________________
📌 Key Points
___________________________________________________________
📊 Chart Explanation
___________________________________________________________
📉 Summary
__________________________________________________________
💡 Why It Matters
___________________________________________________________
📌 Conclusion
___________________________________________________________
⚠️ Disclaimer
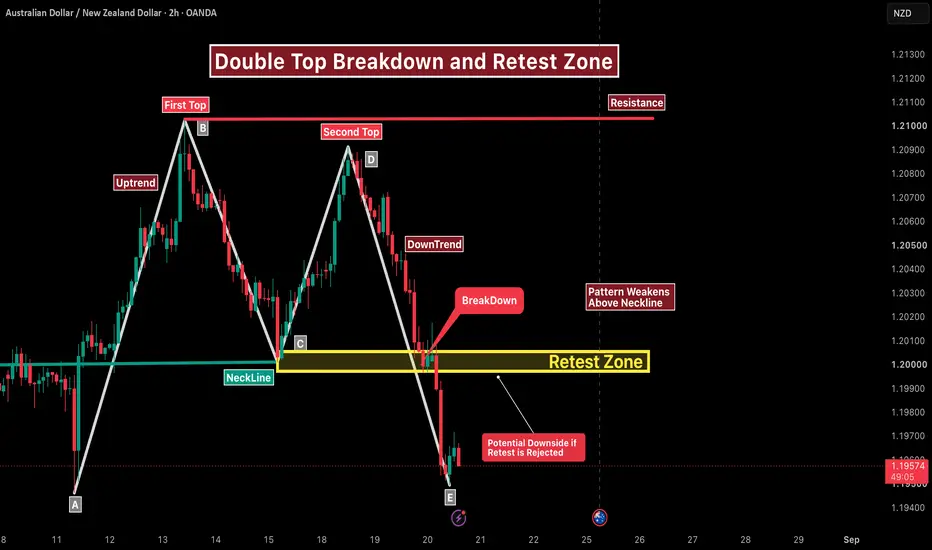
This chart highlights a Double Top pattern, a commonly observed bearish reversal structure that forms after an uptrend. The pattern consists of two peaks near the same resistance level, followed by a breakdown below the neckline, indicating weakening bullish momentum and a possible shift in market structure.
___________________________________________________________
📘 Definition
A Double Top is a chart pattern that forms when price tests a resistance level twice but fails to break higher. The inability to create a new high may indicate reduced buying pressure and increasing seller participation.
• First Top – Initial peak formed after a strong upward move.
• Second Top – Price retests the resistance area but fails to continue higher.
• Resistance – Area where selling pressure repeatedly appears.
• Neckline – Support level formed between the two peaks.
• Breakdown – Price closes below the neckline, confirming weakness.
• Retest Zone – Area where price may revisit the broken neckline before continuing.
___________________________________________________________
📌 Key Points
• Double Tops typically form after an established uptrend.
• Resistance prevents price from moving higher on multiple occasions.
• A neckline breakdown may indicate weakening bullish momentum.
• Retests of the neckline can provide additional confirmation of the structure.
• Market participants often monitor the reaction around the retest zone.
• Pattern validity may weaken if price reclaims the neckline.
___________________________________________________________
📊 Chart Explanation
• Price advanced into a strong resistance area and formed the First Top.
• After a pullback to the neckline, buyers attempted another rally, creating the Second Top.
• The second peak failed to break above resistance, indicating reduced bullish strength.
• Price then moved below the neckline, creating a Breakdown.
• The highlighted Retest Zone represents a key area where price may react.
• If the neckline continues to act as resistance, bearish pressure may remain dominant.
• A sustained move back above the neckline could weaken the current pattern structure.
___________________________________________________________
📉 Summary
The chart shows a Double Top structure followed by a neckline breakdown and a retest area. The pattern illustrates how resistance, support, and market structure interact during potential trend transitions.
__________________________________________________________
💡 Why It Matters
• Helps traders understand reversal structures.
• Demonstrates the importance of resistance and support levels.
• Highlights the role of neckline confirmation.
• Shows how retests can influence market structure.
• Encourages objective chart analysis rather than emotional decision-making.
___________________________________________________________
📌 Conclusion
The Double Top pattern is a widely recognized chart structure used to study potential shifts in market momentum. Understanding resistance, neckline behavior, breakdowns, and retests can help improve chart-reading skills and market awareness.
___________________________________________________________
⚠️ Disclaimer
📘 For educational purposes only.
🙅 Not SEBI registered.
❌ Not a buy/sell recommendation.
🧠 Purely a learning resource.
📊 Not Financial Advice.

Pine Script Developer • Market Analysis
Disclaimer
The information and publications are not meant to be, and do not constitute, financial, investment, trading, or other types of advice or recommendations supplied or endorsed by TradingView. Read more in the Terms of Use.
Pine Script Developer • Market Analysis
Disclaimer
The information and publications are not meant to be, and do not constitute, financial, investment, trading, or other types of advice or recommendations supplied or endorsed by TradingView. Read more in the Terms of Use.