

Overview
⸻⸻⸻⸻⸻⸻⸻⸻⸻⸻⸻
Concept
A Rounding Top develops when price slowly shifts from buying dominance to selling pressure. Instead of a sharp reversal, the market forms a smooth curved structure that reflects gradual distribution by market participants.
⸻⸻⸻⸻⸻⸻⸻⸻⸻⸻⸻
Chart Explanation
⸻⸻⸻⸻⸻⸻⸻⸻⸻⸻⸻
Observation
⸻⸻⸻⸻⸻⸻⸻⸻⸻⸻⸻
Summary
⸻⸻⸻⸻⸻⸻⸻⸻⸻⸻⸻
Disclaimer
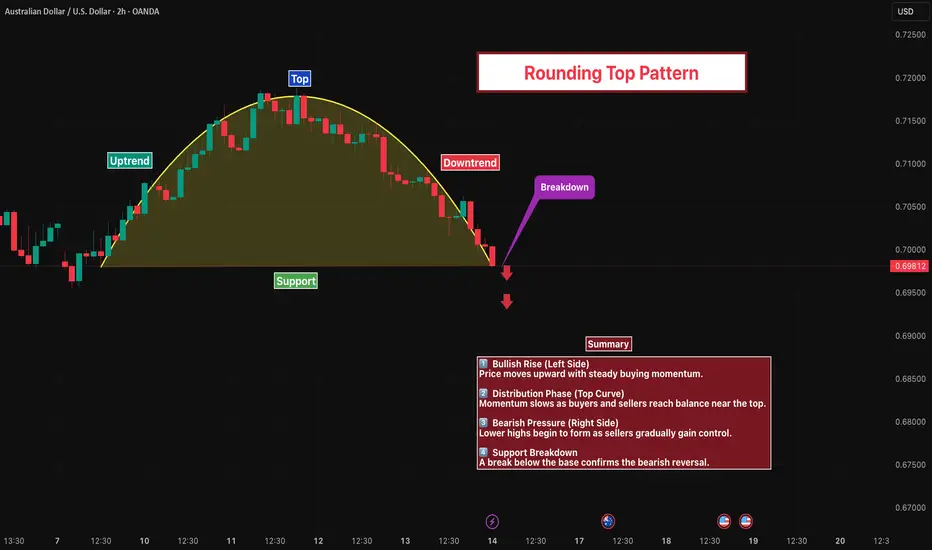
The chart shows a Rounding Top formation, a classic bearish reversal pattern where bullish momentum gradually fades and the market transitions from an uptrend to a downtrend.
⸻⸻⸻⸻⸻⸻⸻⸻⸻⸻⸻
Concept
A Rounding Top develops when price slowly shifts from buying dominance to selling pressure. Instead of a sharp reversal, the market forms a smooth curved structure that reflects gradual distribution by market participants.
⸻⸻⸻⸻⸻⸻⸻⸻⸻⸻⸻
Chart Explanation
1. Uptrend Formation – Price initially moves upward with steady buying momentum.
2. Top Formation – The market begins to slow down near the peak, forming a rounded structure.
3. Distribution Phase – Buyers and sellers reach temporary balance while momentum weakens.
4. Bearish Pressure – Lower highs start to appear, indicating increasing selling pressure.
5. Support Breakdown – Price breaks below the key support level, confirming the bearish reversal.
⸻⸻⸻⸻⸻⸻⸻⸻⸻⸻⸻
Observation
The rounded structure reflects a transition phase where bullish strength weakens and sellers gradually take control of the market.
⸻⸻⸻⸻⸻⸻⸻⸻⸻⸻⸻
Summary
The breakdown below support confirms the Rounding Top pattern and suggests a potential continuation of the downward move as selling pressure increases.
⸻⸻⸻⸻⸻⸻⸻⸻⸻⸻⸻
Disclaimer
📘 For educational purposes only.
🙅 Not SEBI registered.
❌ Not a buy/sell recommendation.
🧠 Purely a learning resource.
📊 Not Financial Advice.

Pine Script Developer • Market Analysis
Disclaimer
The information and publications are not meant to be, and do not constitute, financial, investment, trading, or other types of advice or recommendations supplied or endorsed by TradingView. Read more in the Terms of Use.
Pine Script Developer • Market Analysis
Disclaimer
The information and publications are not meant to be, and do not constitute, financial, investment, trading, or other types of advice or recommendations supplied or endorsed by TradingView. Read more in the Terms of Use.