
**🍬 AVADH SUGAR & ENERGY — Weekly Chart Breakdown**
*Chart by RShivashankar | TradingView*
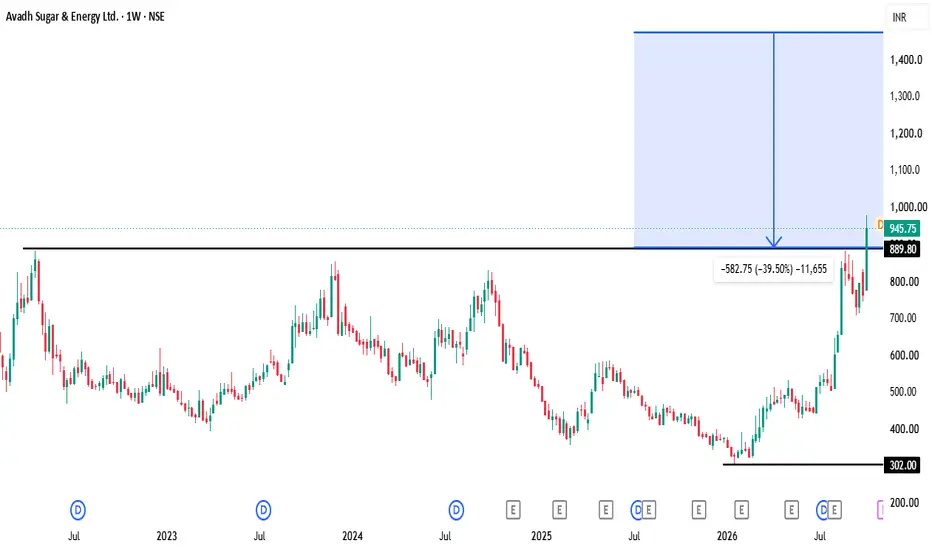
🕯️ **O:** 776.05 | **H:** 978.80 | **L:** 776.05 | **C:** 945.75
🚀 **+23.69%** (+₹181.15) on the week, a very large, wide-range green candle that opened at its low
━━━━━━━━━━━━━━━━
**🔓 THE SETUP**
Price spent roughly 3.5 years capped under the ₹889.80 zone, with multiple rejections visible in 2022, 2024 and mid-2024/25. After bottoming near ₹302 in early 2026, it staged a steep recovery and this week closed decisively above that long-standing ceiling.
**🧱 KEY ZONES**
🔴 Multi-year resistance, now first support to watch: **~₹889.80**
🟢 Major base: **~₹302**
📦 Multiple failed attempts at ₹889.80 before this week, which makes the breakout level well-tested
**⚠️ Points worth flagging to followers:**
- A +23.69% weekly candle is an extreme move. The upper wick (high ₹978.80 vs close ₹945.75) shows some selling near the top, and moves this stretched often see volatility or a retest afterwards
- Price rose from about ₹302 to ₹945 within months, so the stock is already well extended from its base
- The chart has no visible volume pane, so volume confirmation can't be assessed here. Worth adding the volume indicator to your screenshot
**📐 HOW TO MAP YOUR OWN LEVELS**
*(method only, plug in your own risk tolerance)*
1️⃣ **Measured Move:** Range height (₹889.80 − ₹302 ≈ ₹588) projected from the breakout point → reference extension zone above ₹889.80
2️⃣ **Swing-High Zones:** This week's high (₹978.80) is the immediate level to clear
3️⃣ **Stop-Loss Logic:** Below the ₹889.80 breakout zone, or below this week's low (₹776.05), though that low is very far from current price, which means a wide risk distance
4️⃣ **Trailing Rule:** Trail below each new rising weekly swing low as the trend extends
**🔊 CONFIRMATION SIGNS TO WATCH**
✅ Weekly close holding above ₹889.80, ideally a successful retest of that zone
✅ Weekly close above ₹978.80 for continuation
⚠️ Weekly close back below ₹889.80 = breakout failure, structure in question
━━━━━━━━━━━━━━━━
⚠️ **Educational chart analysis only, not investment advice. Not a target/SL recommendation. Please do your own research and consult a registered advisor before trading. Trading involves risk of capital loss.**
---
💡 Since this week's candle is so extended, a line like "Breakout ✅ | Retest to watch 👀" tends to set healthier expectations for followers than pure hype.
*Chart by RShivashankar | TradingView*
🕯️ **O:** 776.05 | **H:** 978.80 | **L:** 776.05 | **C:** 945.75
🚀 **+23.69%** (+₹181.15) on the week, a very large, wide-range green candle that opened at its low
━━━━━━━━━━━━━━━━
**🔓 THE SETUP**
Price spent roughly 3.5 years capped under the ₹889.80 zone, with multiple rejections visible in 2022, 2024 and mid-2024/25. After bottoming near ₹302 in early 2026, it staged a steep recovery and this week closed decisively above that long-standing ceiling.
**🧱 KEY ZONES**
🔴 Multi-year resistance, now first support to watch: **~₹889.80**
🟢 Major base: **~₹302**
📦 Multiple failed attempts at ₹889.80 before this week, which makes the breakout level well-tested
**⚠️ Points worth flagging to followers:**
- A +23.69% weekly candle is an extreme move. The upper wick (high ₹978.80 vs close ₹945.75) shows some selling near the top, and moves this stretched often see volatility or a retest afterwards
- Price rose from about ₹302 to ₹945 within months, so the stock is already well extended from its base
- The chart has no visible volume pane, so volume confirmation can't be assessed here. Worth adding the volume indicator to your screenshot
**📐 HOW TO MAP YOUR OWN LEVELS**
*(method only, plug in your own risk tolerance)*
1️⃣ **Measured Move:** Range height (₹889.80 − ₹302 ≈ ₹588) projected from the breakout point → reference extension zone above ₹889.80
2️⃣ **Swing-High Zones:** This week's high (₹978.80) is the immediate level to clear
3️⃣ **Stop-Loss Logic:** Below the ₹889.80 breakout zone, or below this week's low (₹776.05), though that low is very far from current price, which means a wide risk distance
4️⃣ **Trailing Rule:** Trail below each new rising weekly swing low as the trend extends
**🔊 CONFIRMATION SIGNS TO WATCH**
✅ Weekly close holding above ₹889.80, ideally a successful retest of that zone
✅ Weekly close above ₹978.80 for continuation
⚠️ Weekly close back below ₹889.80 = breakout failure, structure in question
━━━━━━━━━━━━━━━━
⚠️ **Educational chart analysis only, not investment advice. Not a target/SL recommendation. Please do your own research and consult a registered advisor before trading. Trading involves risk of capital loss.**
---
💡 Since this week's candle is so extended, a line like "Breakout ✅ | Retest to watch 👀" tends to set healthier expectations for followers than pure hype.

Disclaimer
The information and publications are not meant to be, and do not constitute, financial, investment, trading, or other types of advice or recommendations supplied or endorsed by TradingView. Read more in the Terms of Use.
Disclaimer
The information and publications are not meant to be, and do not constitute, financial, investment, trading, or other types of advice or recommendations supplied or endorsed by TradingView. Read more in the Terms of Use.