
Technical Update: Liquidity Cascade, Key OBs, and FVG Targets
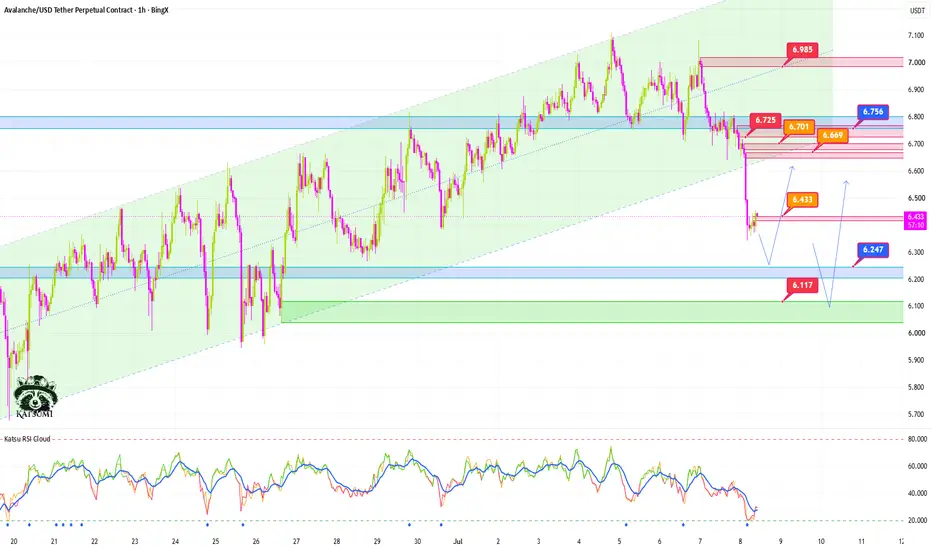
The price had been moving nicely inside an ascending channel until yesterday, when it broke down from the structure.
The current drop was caught by an older Order Block, but it is clearly visible that the large bearish candle was not random. As price moved lower, long positions were likely stopped out one after another, adding extra sell pressure to the move.
I marked a support zone in blue, which could hold the price if the decline continues. If that level fails, I marked a stronger Order Block in green, where price could potentially react and turn back to the upside.
It is also worth noting that the move left behind an FVG. If price bounces, this imbalance could later be revisited, which may offer a clean trading opportunity.
I also marked the bearish Order Blocks above. The orange zones represent smaller, weaker OBs, while the red zones are stronger resistance areas.

Whenever price reaches these zones, something usually happens: price may reject, consolidate, or break through and accelerate. That is why I marked them. These areas can be traded well if we combine them with additional confirmation, such as candlestick patterns, volume, lower-timeframe RSI, or other signals.
The RSI still looks acceptable, and there is no clear divergence. On the 1H timeframe, RSI is currently in oversold territory, so a short-term bounce or sideways movement would not be surprising before the market cools down and potentially attempts another move lower.
I marked the path I am currently watching on the chart. My main scenario is that price may move slightly lower first, then potentially start turning back to the upside from one of the marked demand zones.
Supports: 6.247 / 6.117
Minor resistances: 6.433 / 6.669 / 6.701
Major resistances: 6.725 / 6.756 / 6.985
Please treat these levels as zones, not exact prices. That is why I draw areas instead of single lines.
The current drop was caught by an older Order Block, but it is clearly visible that the large bearish candle was not random. As price moved lower, long positions were likely stopped out one after another, adding extra sell pressure to the move.
I marked a support zone in blue, which could hold the price if the decline continues. If that level fails, I marked a stronger Order Block in green, where price could potentially react and turn back to the upside.
It is also worth noting that the move left behind an FVG. If price bounces, this imbalance could later be revisited, which may offer a clean trading opportunity.
I also marked the bearish Order Blocks above. The orange zones represent smaller, weaker OBs, while the red zones are stronger resistance areas.
Whenever price reaches these zones, something usually happens: price may reject, consolidate, or break through and accelerate. That is why I marked them. These areas can be traded well if we combine them with additional confirmation, such as candlestick patterns, volume, lower-timeframe RSI, or other signals.
The RSI still looks acceptable, and there is no clear divergence. On the 1H timeframe, RSI is currently in oversold territory, so a short-term bounce or sideways movement would not be surprising before the market cools down and potentially attempts another move lower.
I marked the path I am currently watching on the chart. My main scenario is that price may move slightly lower first, then potentially start turning back to the upside from one of the marked demand zones.
Supports: 6.247 / 6.117
Minor resistances: 6.433 / 6.669 / 6.701
Major resistances: 6.725 / 6.756 / 6.985
Please treat these levels as zones, not exact prices. That is why I draw areas instead of single lines.

Magyar Discord Szerver. Oktatás, elemzés, scriptek mind egy helyen -> itt minden infót megtalálsz -> trackmirror.eu
Disclaimer
The information and publications are not meant to be, and do not constitute, financial, investment, trading, or other types of advice or recommendations supplied or endorsed by TradingView. Read more in the Terms of Use.
Magyar Discord Szerver. Oktatás, elemzés, scriptek mind egy helyen -> itt minden infót megtalálsz -> trackmirror.eu
Disclaimer
The information and publications are not meant to be, and do not constitute, financial, investment, trading, or other types of advice or recommendations supplied or endorsed by TradingView. Read more in the Terms of Use.