
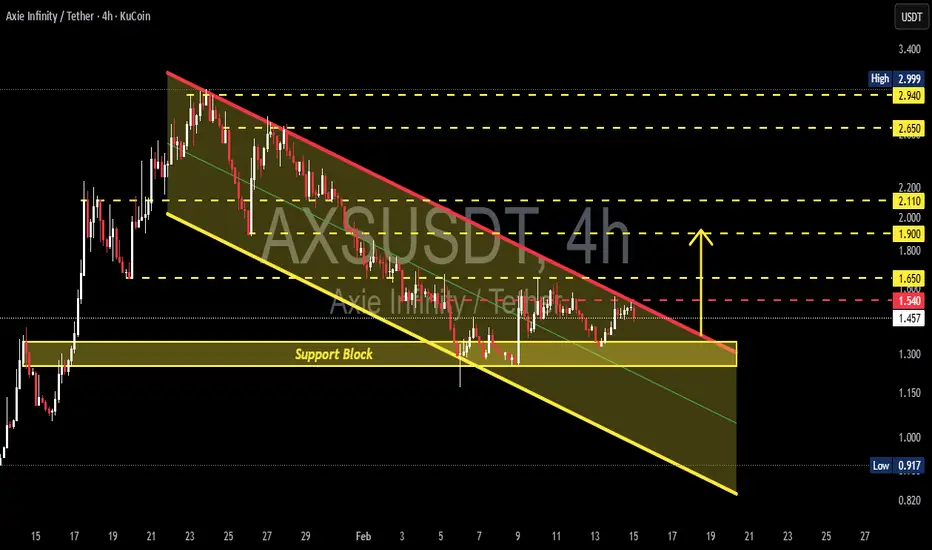
The Axie Infinity / USDT pair on the 4H timeframe is still within a mid-term downtrend structure after failing to hold the supply area around 2.9 – 3.0 USDT.
Price action continues forming consistent Lower Highs (LH) and Lower Lows (LL), indicating strong seller dominance. Currently, price is consolidating right above a crucial support block following rejection from the main trendline resistance.
---
Structure & Pattern Formation
1. Descending Channel / Falling Wedge Hybrid
Two descending trendlines are visible:
Resistance trendline (red) → connecting LHs.
Support trendline (yellow) → holding LLs.
Structure is tightening → indicates volatility compression.
This type of pattern often results in:
Continuation if breakdown occurs.
Reversal if an upside breakout happens.
2. Support Block Demand Zone
The strong demand area is located at:
1.30 – 1.35 USDT
Key confluence factors:
Previous base before impulsive rally.
Multiple wick rejections.
Volume absorption showing buyer defense.
---
Key Levels
Resistance:
1.54 → Minor resistance / latest rejection.
1.65 → Mid-channel resistance.
1.90 → Horizontal resistance.
2.11 → Supply flip area.
2.65 → Major resistance.
2.94 – 3.00 → Macro supply / swing high.
Support:
1.30 – 1.35 → Major support block.
1.15 → Minor channel support.
0.91 → Extreme low / liquidity target.
---
Bullish Scenario
Bullish confirmation requires:
1. Breakout above the red resistance trendline.
2. Strong candle close above 1.54.
3. Successful retest turning resistance into support.
Upside targets:
1.65
1.90
2.11
2.65
2.94
Additional confirmation:
Volume expansion on breakout.
Bullish RSI divergence (if present).
Market structure shift from LH → HH.
Meaning:
Buyers escape channel pressure and initiate a mid-term reversal phase.
---
Bearish Scenario
Bearish continuation activates if:
1. The 1.30 – 1.35 support block breaks.
2. Candle closes below the demand zone.
3. Retest fails to reclaim the area.
Downside targets:
1.15
1.00 psychological level
0.91 (liquidity sweep zone)
A breakdown would confirm a new Lower Low, continuing the downtrend structure.
---
Conclusion
Primary trend: Bearish (mid-term)
Current position: Above key demand
Structure: Descending channel compression
Potential: Reversal on breakout / Dump on support loss
This is a decision zone.
Price reaction between 1.30 – 1.54 will determine whether AXS:
Starts a relief rally.
Or continues distribution lower.
#AXSUSDT #AXSAnalysis #CryptoTechnicalAnalysis #AltcoinSetup #DescendingChannel #SupportResistance #DemandZone #BreakoutSetup #TradingViewAnalysis #CryptoTrading #AltcoinSeason #PriceAction
Price action continues forming consistent Lower Highs (LH) and Lower Lows (LL), indicating strong seller dominance. Currently, price is consolidating right above a crucial support block following rejection from the main trendline resistance.
---
Structure & Pattern Formation
1. Descending Channel / Falling Wedge Hybrid
Two descending trendlines are visible:
Resistance trendline (red) → connecting LHs.
Support trendline (yellow) → holding LLs.
Structure is tightening → indicates volatility compression.
This type of pattern often results in:
Continuation if breakdown occurs.
Reversal if an upside breakout happens.
2. Support Block Demand Zone
The strong demand area is located at:
1.30 – 1.35 USDT
Key confluence factors:
Previous base before impulsive rally.
Multiple wick rejections.
Volume absorption showing buyer defense.
---
Key Levels
Resistance:
1.54 → Minor resistance / latest rejection.
1.65 → Mid-channel resistance.
1.90 → Horizontal resistance.
2.11 → Supply flip area.
2.65 → Major resistance.
2.94 – 3.00 → Macro supply / swing high.
Support:
1.30 – 1.35 → Major support block.
1.15 → Minor channel support.
0.91 → Extreme low / liquidity target.
---
Bullish Scenario
Bullish confirmation requires:
1. Breakout above the red resistance trendline.
2. Strong candle close above 1.54.
3. Successful retest turning resistance into support.
Upside targets:
1.65
1.90
2.11
2.65
2.94
Additional confirmation:
Volume expansion on breakout.
Bullish RSI divergence (if present).
Market structure shift from LH → HH.
Meaning:
Buyers escape channel pressure and initiate a mid-term reversal phase.
---
Bearish Scenario
Bearish continuation activates if:
1. The 1.30 – 1.35 support block breaks.
2. Candle closes below the demand zone.
3. Retest fails to reclaim the area.
Downside targets:
1.15
1.00 psychological level
0.91 (liquidity sweep zone)
A breakdown would confirm a new Lower Low, continuing the downtrend structure.
---
Conclusion
Primary trend: Bearish (mid-term)
Current position: Above key demand
Structure: Descending channel compression
Potential: Reversal on breakout / Dump on support loss
This is a decision zone.
Price reaction between 1.30 – 1.54 will determine whether AXS:
Starts a relief rally.
Or continues distribution lower.
#AXSUSDT #AXSAnalysis #CryptoTechnicalAnalysis #AltcoinSetup #DescendingChannel #SupportResistance #DemandZone #BreakoutSetup #TradingViewAnalysis #CryptoTrading #AltcoinSeason #PriceAction

✅ Get Free Signals! Join Our Telegram Channel Here: t.me/TheCryptoNuclear
✅ Twitter: twitter.com/crypto_nuclear
✅ Join Bybit : partner.bybit.com/b/nuclearvip
✅ Benefits : Lifetime Trading Fee Discount -50%
✅ Twitter: twitter.com/crypto_nuclear
✅ Join Bybit : partner.bybit.com/b/nuclearvip
✅ Benefits : Lifetime Trading Fee Discount -50%
Disclaimer
The information and publications are not meant to be, and do not constitute, financial, investment, trading, or other types of advice or recommendations supplied or endorsed by TradingView. Read more in the Terms of Use.
✅ Get Free Signals! Join Our Telegram Channel Here: t.me/TheCryptoNuclear
✅ Twitter: twitter.com/crypto_nuclear
✅ Join Bybit : partner.bybit.com/b/nuclearvip
✅ Benefits : Lifetime Trading Fee Discount -50%
✅ Twitter: twitter.com/crypto_nuclear
✅ Join Bybit : partner.bybit.com/b/nuclearvip
✅ Benefits : Lifetime Trading Fee Discount -50%
Disclaimer
The information and publications are not meant to be, and do not constitute, financial, investment, trading, or other types of advice or recommendations supplied or endorsed by TradingView. Read more in the Terms of Use.