
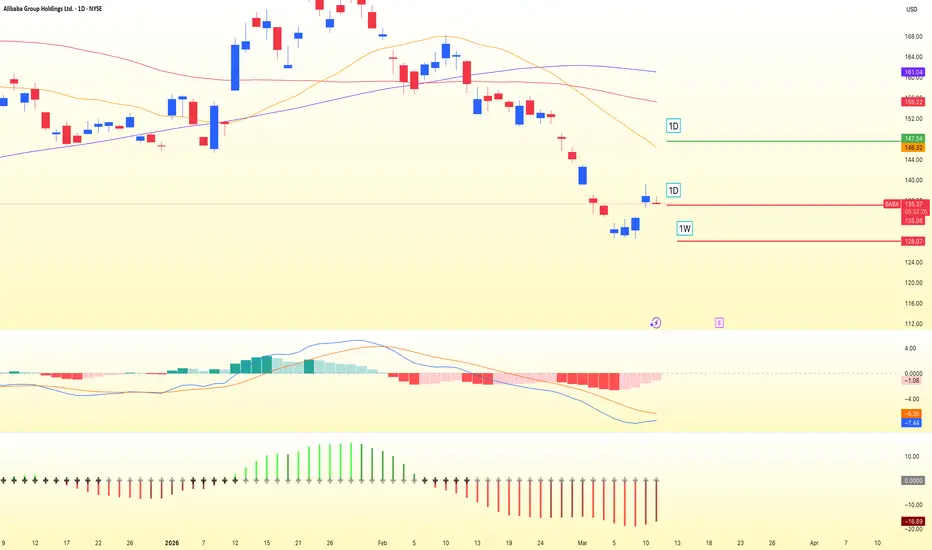
BABA is at a decisive point after a sharp loss of momentum from the $190 peak. On the 1D chart, price has broken below the MA20, MA60, and MA120, while the broader structure has shifted into a confirmed descending channel. Trading near $135.57, the stock is now pressing against a fragile support area, with bearish momentum still dominant across MACD, SQZMOM, and SuperTrend. The weekly chart adds to that caution, with price testing the MA60 near $137.75 while the medium-term rally structure begins to look exhausted.
The primary path remains bearish unless Alibaba can reclaim the broken resistance zone. Support sits at $128.55, and a daily close below $135.00 would strengthen the continuation case toward $128.00 first, then potentially $120.00. If the weekly structure gives way with a close below $128.00, that would open the door to a deeper macro breakdown toward $100.00. For now, sellers still control the tape, and every failed bounce into resistance keeps that pressure intact.
The alternative scenario is a relief rally, but it needs proof. A daily close above $148.00 would signal a break of the channel’s upper boundary and a reclaim of the $146.33 resistance zone, which could shift the move toward $155.00 and possibly $170.00. Until that happens, rebounds look more like mean-reversion than trend reversal
The primary path remains bearish unless Alibaba can reclaim the broken resistance zone. Support sits at $128.55, and a daily close below $135.00 would strengthen the continuation case toward $128.00 first, then potentially $120.00. If the weekly structure gives way with a close below $128.00, that would open the door to a deeper macro breakdown toward $100.00. For now, sellers still control the tape, and every failed bounce into resistance keeps that pressure intact.
The alternative scenario is a relief rally, but it needs proof. A daily close above $148.00 would signal a break of the channel’s upper boundary and a reclaim of the $146.33 resistance zone, which could shift the move toward $155.00 and possibly $170.00. Until that happens, rebounds look more like mean-reversion than trend reversal

follow my X 👉 x.com/bbqgio
🔥 level up your Stock, FX, & Crypto: VIP access to AI technical analysis and pro market insights at TradeOS + 50%-off promo code ONBOARD 👉
ai.tradeos.xyz/?utm_source=tvbg
🔥 level up your Stock, FX, & Crypto: VIP access to AI technical analysis and pro market insights at TradeOS + 50%-off promo code ONBOARD 👉
ai.tradeos.xyz/?utm_source=tvbg
Related publications
Disclaimer
The information and publications are not meant to be, and do not constitute, financial, investment, trading, or other types of advice or recommendations supplied or endorsed by TradingView. Read more in the Terms of Use.
follow my X 👉 x.com/bbqgio
🔥 level up your Stock, FX, & Crypto: VIP access to AI technical analysis and pro market insights at TradeOS + 50%-off promo code ONBOARD 👉
ai.tradeos.xyz/?utm_source=tvbg
🔥 level up your Stock, FX, & Crypto: VIP access to AI technical analysis and pro market insights at TradeOS + 50%-off promo code ONBOARD 👉
ai.tradeos.xyz/?utm_source=tvbg
Related publications
Disclaimer
The information and publications are not meant to be, and do not constitute, financial, investment, trading, or other types of advice or recommendations supplied or endorsed by TradingView. Read more in the Terms of Use.