 BAJAJHCARE
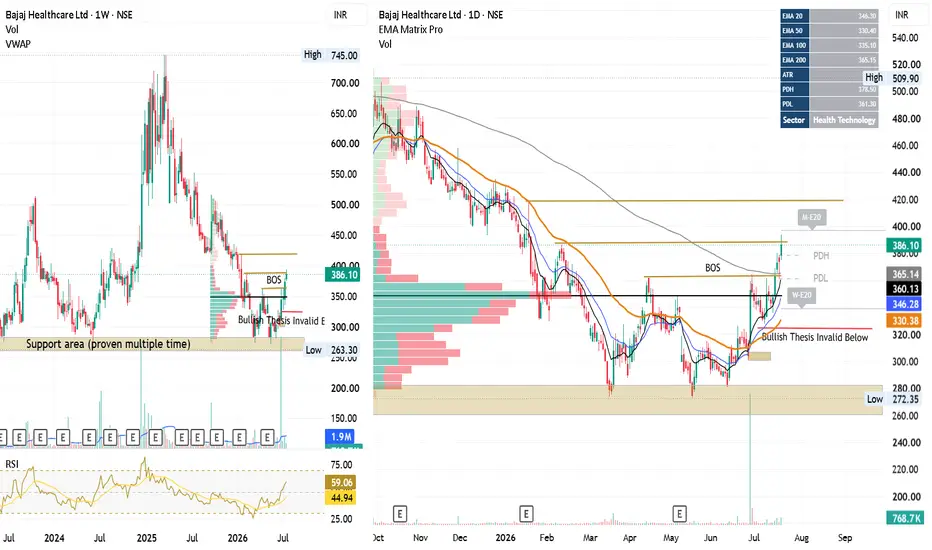
Bajaj Healthcare Ltd. has shown a strong recovery from its long-term support zone around ₹260–280, an area that has been defended multiple times on the weekly chart.
The recent move above the previous swing high has resulted in a clear Break of Structure (BOS), indicating that the stock may be transitioning from a prolonged corrective phase into a new bullish structure.
Key observations:
• Multi-tested weekly demand zone remains intact.
• Price has reclaimed the high-volume accumulation area.
• Daily structure has shifted from lower highs to higher highs.
• Price is trading above EMA20, EMA50, EMA100 and EMA200.
• EMA200 is now acting as an important reference level.
• Weekly RSI has moved back above 50, supporting improving momentum.
Important levels:
Immediate Support : ₹360–365
Structure Support : ₹330–340
Major Demand : ₹260–275
Near Resistance : ₹420
Next Resistance :₹470
Major Resistance: ₹520
Trading plan: As long as price sustains above the ₹330–340 structure zone, the bullish setup remains valid. A successful hold above ₹360–365 could open the path toward ₹420 and higher resistance levels.
Bullish thesis invalidation: A decisive breakdown below the marked invalidation zone would weaken the current bullish structure and increase the probability of a deeper retracement.
Educational observation: The chart currently reflects a classic sequence of demand absorption → accumulation → BOS → potential markup phase, making it an interesting case study for positional and swing traders.
------------------------------------------------------------------------------------------------------------------
Disclaimer: This analysis is shared purely for educational and informational purposes. It is not investment advice, a recommendation, or a solicitation to buy or sell any security. Please conduct your own research and manage risk appropriately before taking any trade.

Disclaimer
The information and publications are not meant to be, and do not constitute, financial, investment, trading, or other types of advice or recommendations supplied or endorsed by TradingView. Read more in the Terms of Use.
Disclaimer
The information and publications are not meant to be, and do not constitute, financial, investment, trading, or other types of advice or recommendations supplied or endorsed by TradingView. Read more in the Terms of Use.