
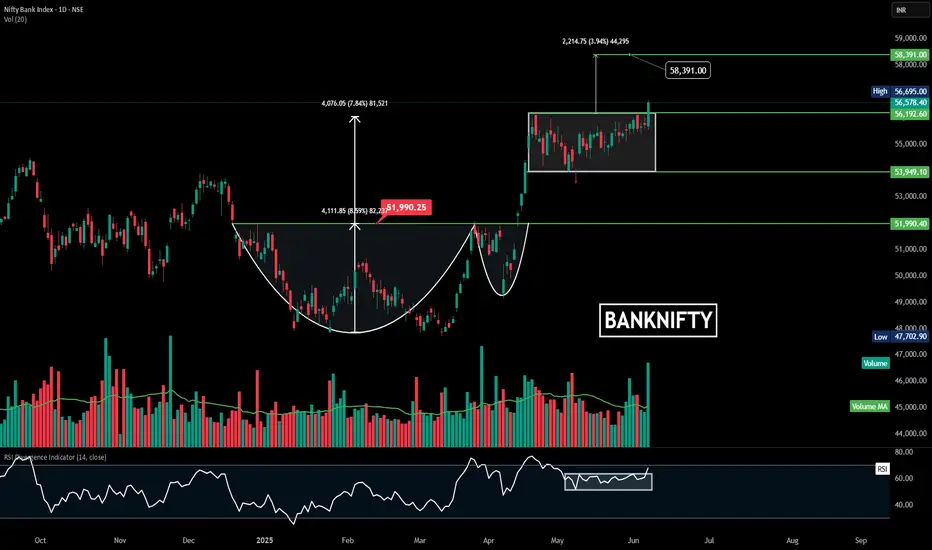
Here’s a technical summary for the BANKNIFTY Index based on the chart:
✅ Pattern: Consolidation breakout is visible.
✅ Breakout Zone: Price has successfully broken out of the consolidation range near 53,949–56,192 levels.
✅ Target Projection: The measured move suggests a potential upside target at 58,391.
✅ Volume & RSI: Volume is confirming the breakout. RSI (14) is at 67.45, indicating strong momentum with a potential for slight overbought caution.
⚠️ Key Levels to Watch:
Support: 56,192 (breakout zone) and 53,949
Resistance: Next potential resistance at 58,391
RSI Divergence: Consolidation breakout.
Outlook: The index looks strongly bullish with a clear target of 58,391. However, if there’s a failed follow-up to this breakout, the 56,190 range level will act as immediate support for any pullback.
✅ Pattern: Consolidation breakout is visible.
✅ Breakout Zone: Price has successfully broken out of the consolidation range near 53,949–56,192 levels.
✅ Target Projection: The measured move suggests a potential upside target at 58,391.
✅ Volume & RSI: Volume is confirming the breakout. RSI (14) is at 67.45, indicating strong momentum with a potential for slight overbought caution.
⚠️ Key Levels to Watch:
Support: 56,192 (breakout zone) and 53,949
Resistance: Next potential resistance at 58,391
RSI Divergence: Consolidation breakout.
Outlook: The index looks strongly bullish with a clear target of 58,391. However, if there’s a failed follow-up to this breakout, the 56,190 range level will act as immediate support for any pullback.

Disclaimer
The information and publications are not meant to be, and do not constitute, financial, investment, trading, or other types of advice or recommendations supplied or endorsed by TradingView. Read more in the Terms of Use.
Disclaimer
The information and publications are not meant to be, and do not constitute, financial, investment, trading, or other types of advice or recommendations supplied or endorsed by TradingView. Read more in the Terms of Use.