
Bata India — Weekly and Monthly Chart Study
NSE: BATAINDIA
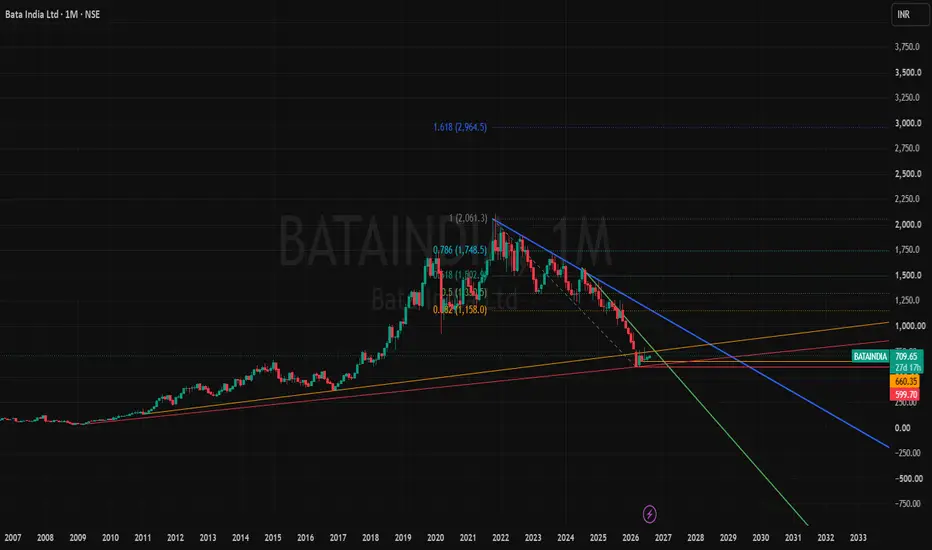
After a prolonged correction from above ₹2,000, Bata India is attempting to stabilize near an important long-term support area.
The present move is constructive, but the larger trend has not reversed yet. The first test is near ₹720–740, while a sustained move above ₹780–800 would provide stronger evidence of a weekly trend change.
Current stage: Early Recovery Watch
Primary timeframe: Weekly and monthly
Approach: Long-term weekly trend-change tracking
Chart observations
Price has corrected significantly from its 2021–22 highs.
A possible base is developing around the ₹600–660 support belt.
The stock is currently testing a multi-year falling trendline.
Weekly momentum has started improving from deeply negative territory.
The latest candles show stabilization, but major moving-average resistance remains overhead.
The monthly structure is still weak and requires stronger closing confirmation.
Positive scenario
A sustained weekly close above ₹720–740 can confirm the first breakout attempt from the falling trendline.
The next important test would be the ₹780–800 zone, where broader weekly resistance and moving averages are visible.
A successful weekly breakout and support retention above ₹800 can improve the structure toward ₹850–870.
A sustained move above ₹850–870 would represent a stronger long-term trend-change signal. In that scenario, ₹1,000–1,060 and later ₹1,150–1,200 may become broader resistance/reference zones.
Neutral scenario
Bata India may continue consolidating between approximately ₹650 and ₹740 while the base develops.
Such consolidation can remain constructive if the ₹650–660 support zone continues to hold, but sideways movement alone would not confirm a long-term reversal.
Weakness scenario
Failure to hold ₹680–700 may result in another test of the important ₹650–660 support zone.
A sustained breakdown below ₹650 can expose the stock to the major ₹595–600 structural support area.
A decisive monthly close below ₹595–600 would materially weaken the current base-formation thesis and indicate that the broader correction may not be complete.
Key levels
Immediate support: ₹680–700
Important support: ₹650–660
Major structural support: ₹595–600
First breakout zone: ₹720–740
Stronger weekly confirmation: ₹780–800
Major trend-change resistance: ₹850–870
Higher resistance references: ₹1,000–1,060 / ₹1,150–1,200
For now, Bata India remains an early recovery and base-formation watch, rather than a confirmed long-term uptrend.
The chart begins to improve above ₹720–740, but stronger conviction would require a sustained weekly close above ₹780–800 and later ₹850–870.
Long-term tracking does not mean passively holding regardless of structure. The thesis should continue to be reviewed through weekly confirmation, support retention, business performance and valuation. After a substantial move, capital-protection and position-risk review may also become relevant.
Shared only for educational study and public chart-tracking purposes. This is not a buy, sell, hold, averaging, portfolio-allocation or return recommendation. I am not a SEBI-registered Investment Adviser or Research Analyst. The levels shown are conditional chart references, not guaranteed outcomes. Market conditions can change and the setup may fail. Please conduct independent research and consult a qualified SEBI-registered professional before making any investment decision. I am not responsible for any profit or loss arising from the use of this post.
#BATAINDIA #BataIndia #FootwearStocks #ConsumerStocks #WeeklyChart #MonthlyChart #BaseFormation #RecoveryAttempt #TrendChange #BreakoutWatch #SupportAndResistance #StockMarketIndia
NSE: BATAINDIA
After a prolonged correction from above ₹2,000, Bata India is attempting to stabilize near an important long-term support area.
The present move is constructive, but the larger trend has not reversed yet. The first test is near ₹720–740, while a sustained move above ₹780–800 would provide stronger evidence of a weekly trend change.
Current stage: Early Recovery Watch
Primary timeframe: Weekly and monthly
Approach: Long-term weekly trend-change tracking
Chart observations
Price has corrected significantly from its 2021–22 highs.
A possible base is developing around the ₹600–660 support belt.
The stock is currently testing a multi-year falling trendline.
Weekly momentum has started improving from deeply negative territory.
The latest candles show stabilization, but major moving-average resistance remains overhead.
The monthly structure is still weak and requires stronger closing confirmation.
Positive scenario
A sustained weekly close above ₹720–740 can confirm the first breakout attempt from the falling trendline.
The next important test would be the ₹780–800 zone, where broader weekly resistance and moving averages are visible.
A successful weekly breakout and support retention above ₹800 can improve the structure toward ₹850–870.
A sustained move above ₹850–870 would represent a stronger long-term trend-change signal. In that scenario, ₹1,000–1,060 and later ₹1,150–1,200 may become broader resistance/reference zones.
Neutral scenario
Bata India may continue consolidating between approximately ₹650 and ₹740 while the base develops.
Such consolidation can remain constructive if the ₹650–660 support zone continues to hold, but sideways movement alone would not confirm a long-term reversal.
Weakness scenario
Failure to hold ₹680–700 may result in another test of the important ₹650–660 support zone.
A sustained breakdown below ₹650 can expose the stock to the major ₹595–600 structural support area.
A decisive monthly close below ₹595–600 would materially weaken the current base-formation thesis and indicate that the broader correction may not be complete.
Key levels
Immediate support: ₹680–700
Important support: ₹650–660
Major structural support: ₹595–600
First breakout zone: ₹720–740
Stronger weekly confirmation: ₹780–800
Major trend-change resistance: ₹850–870
Higher resistance references: ₹1,000–1,060 / ₹1,150–1,200
For now, Bata India remains an early recovery and base-formation watch, rather than a confirmed long-term uptrend.
The chart begins to improve above ₹720–740, but stronger conviction would require a sustained weekly close above ₹780–800 and later ₹850–870.
Long-term tracking does not mean passively holding regardless of structure. The thesis should continue to be reviewed through weekly confirmation, support retention, business performance and valuation. After a substantial move, capital-protection and position-risk review may also become relevant.
Shared only for educational study and public chart-tracking purposes. This is not a buy, sell, hold, averaging, portfolio-allocation or return recommendation. I am not a SEBI-registered Investment Adviser or Research Analyst. The levels shown are conditional chart references, not guaranteed outcomes. Market conditions can change and the setup may fail. Please conduct independent research and consult a qualified SEBI-registered professional before making any investment decision. I am not responsible for any profit or loss arising from the use of this post.
#BATAINDIA #BataIndia #FootwearStocks #ConsumerStocks #WeeklyChart #MonthlyChart #BaseFormation #RecoveryAttempt #TrendChange #BreakoutWatch #SupportAndResistance #StockMarketIndia

Disclaimer
The information and publications are not meant to be, and do not constitute, financial, investment, trading, or other types of advice or recommendations supplied or endorsed by TradingView. Read more in the Terms of Use.
Disclaimer
The information and publications are not meant to be, and do not constitute, financial, investment, trading, or other types of advice or recommendations supplied or endorsed by TradingView. Read more in the Terms of Use.