
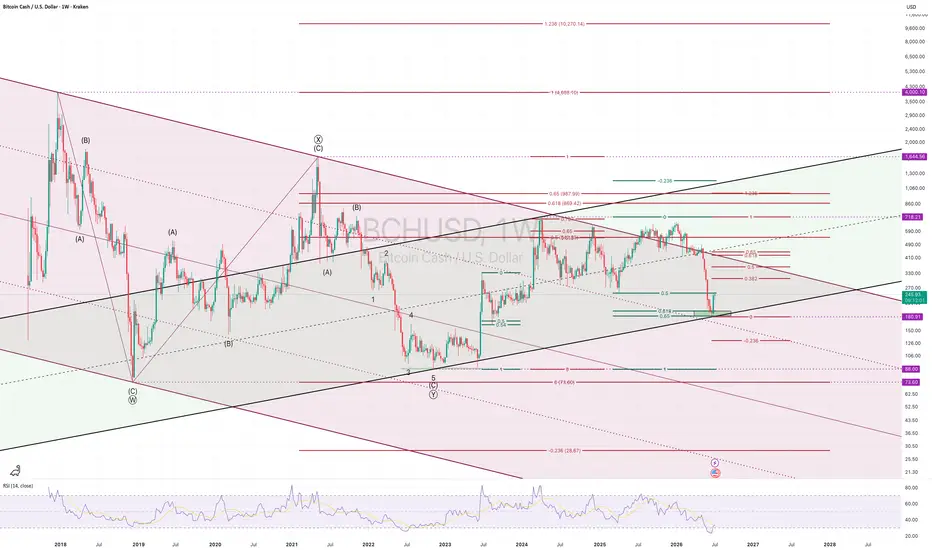
 BCH Bitcoin Cash has arrived at what I consider the most important price level of the entire macro structure.
The recent sell-off found support almost perfectly inside the weekly Golden Zone (GZ) around $180, where several technical factors converge. This area is far more than just another support level—it represents the crossroads that will likely determine the next multi-year direction for BCH.
As long as the weekly Golden Zone continues to hold, my Elliott Wave count remains constructive. The market may still be completing a large corrective structure before beginning the next impulsive advance. If this interpretation proves correct, the long-term target remains the $4,000 region, with an ALGO take-profit objective near $10,270.
However, this bullish outlook still requires confirmation.
The first technical confirmation would be a decisive break above the daily Golden Zone, currently located around $443. Reclaiming that level would strengthen the bullish wave count considerably and suggest that the recent decline has indeed completed its corrective phase.
On the other hand, the current support cannot be lost. A sustained breakdown below the $180 weekly Golden Zone would invalidate my preferred bullish scenario and significantly increase the probability that BCH is still unfolding a much larger bearish structure. In that case, the next major downside objective shifts dramatically towards approximately $28.67.
This is why I believe the current price region deserves close attention. Markets rarely provide such clearly defined technical crossroads where both the bullish and bearish scenarios are so well separated by one critical level.
For now, Bitcoin Cash remains compressed between long-term support and multi-year resistance. The longer this compression persists, the more significant the eventual breakout is likely to become.
As always, Elliott Wave analysis is about probabilities rather than certainties. The market will ultimately determine which path unfolds—but from my perspective, $180 is the line that separates a potential multi-year bull market from the risk of one final capitulation.
Like and follow for more Elliott Wave and macro crypto analysis.

In technical analysis, several methods focus on higher timeframes to provide a broader, more reliable context for trading or investment decisions. Elliott Wave Principle generally considers historical higher timeframes as mandatory.
Related publications
Disclaimer
The information and publications are not meant to be, and do not constitute, financial, investment, trading, or other types of advice or recommendations supplied or endorsed by TradingView. Read more in the Terms of Use.
In technical analysis, several methods focus on higher timeframes to provide a broader, more reliable context for trading or investment decisions. Elliott Wave Principle generally considers historical higher timeframes as mandatory.
Related publications
Disclaimer
The information and publications are not meant to be, and do not constitute, financial, investment, trading, or other types of advice or recommendations supplied or endorsed by TradingView. Read more in the Terms of Use.