
Key Highlights
BE Stock Trend Analysis
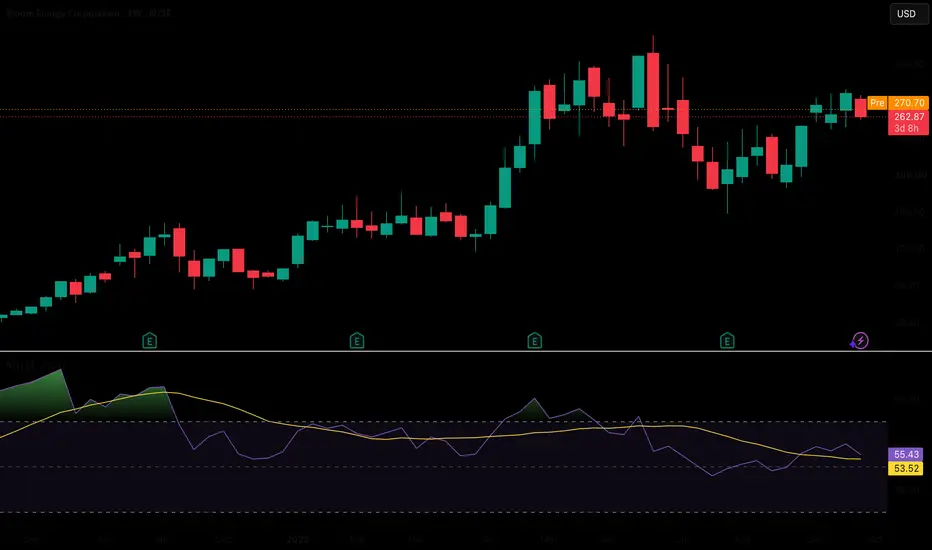
The one-year candlestick chart shows four distinct phases.
Base building (November to March): the stock moved sideways to higher in a broad range of roughly $80 to $180. Small, mixed candles showed buyers and sellers in balance.
Breakout and peak (April to June): a run of large green candles carried shares from the $170s to about $300, then to a peak near the 52-week high of $351.28. The tall red candle after the peak shows heavy profit taking.
Correction (July to August): BE gave back a large part of its gains and fell to roughly the $160 to $190 area, close to the 200-day averages near $203, where long-term buyers often step in.
Recovery (August to September): higher lows and a string of green candles pushed the stock back to about $289, near the $300 area where it traded for most of May and June.
The primary trend remains bullish. The intermediate trend is a recovery supported by higher lows, while the short-term trend is stretched after a roughly 35% monthly gain.
A weekly close above $300 would strengthen the continuation case. The larger resistance test remains the $330 to $351 zone.
Bloom Energy Stock Price Overview
BE closed September 25 at $288.70, up $22.05 or 8.27%.
The stock opened at $269.91, reached a session high of $292.72, and traded as low as $264.01.
Over one month, the stock gained $74.75, or 34.94%. Over one year, it gained $204.97, or 244.8%.
The 52-week high stands at $351.28.
BE has a beta of about 3.8, indicating that the stock has historically moved much more sharply than the broader market.
September strength followed confirmation that Bloom Energy joined the S&P 500, effective before the open on September 21.
Index inclusion can increase passive fund buying and market attention, but that effect can also fade once index-related buying is completed.
Support and Resistance Levels
The first resistance zone is $292.72 to $295, based on Friday’s session high and the nearby round-number area.
The next level is $304.57, corresponding to the Woodie R3 pivot and sitting just above the psychological $300 level.
Above that, $325 to $335 represents a broader resistance zone based on weekly highs reached during May and June.
Major resistance sits between $349.94 and $351.28. The Classic R3 pivot at $349.94 nearly overlaps the 52-week high of $351.28.
On the downside, $282.56 is an initial reference point. It corresponds to the Classic R2 and Fibonacci R3 pivot.
The first major support zone is $269.91 to $271.28, combining Friday’s opening price, the 10-day EMA at $271.16, and the 10-day SMA at $271.28.
Below that, $256.50 to $260.56 combines the 20-day SMA at $256.50, the 20-day EMA at $259.73, and the 20-day VWMA at $260.56.
A deeper support zone sits at $229.68 to $246.03, where the 50-day SMA, 50-day EMA, and Ichimoku base line at $239.33 are located.
Long-term support is concentrated around $202.96 to $204.15, where the 200-day SMA and EMA sit.
Moving Averages
TradingView tracks 15 moving average signals for BE.
Fourteen read Buy, one reads Neutral, and none read Sell, giving the group an overall Strong Buy rating.
The averages are also stacked in bullish order.
The 10-day EMA at $271.16 sits above the 20-day EMA at $259.73, which sits above the 50-day EMA at $246.03, which in turn sits above the 200-day EMA at $204.15.
The SMAs show the same general structure.
This alignment is consistent with a healthy uptrend because shorter-term prices are rising faster than longer-term prices.
However, BE is also significantly extended above those averages.
At $288.70, the stock trades about 6% above its 10-day SMA, 13% above its 20-day SMA, 26% above its 50-day SMA, and 42% above its 200-day SMA.
That degree of extension increases the probability of consolidation or a pullback toward the moving averages.
RSI, MACD and Momentum Indicators
TradingView lists 11 oscillators for BE, with 3 Buy, 8 Neutral, and 0 Sell signals.
RSI stands at 62.80. A reading above 50 indicates bullish momentum, while remaining below 70 means the stock is not yet in classic overbought territory.
MACD is 13.92 with a Buy signal, supporting the broader bullish momentum picture.
Momentum at 12.95 and Bull Bear Power at 21.75 also produce Buy signals.
Stochastic %K is 77.74, close to the 80 level usually associated with overbought conditions.
Williams %R is minus 9.21, a reading normally associated with overbought conditions, although TradingView still labels it Neutral.
CCI is 81.37, elevated but below the +100 level often associated with a stronger overbought push.
ADX is 16.42. A reading below 20 suggests that short-term trend strength remains relatively weak.
Stochastic RSI Fast stands at 24.29, indicating that shorter-term momentum has already cooled.
Taken together, the indicators show a bullish medium-term structure with warm but not extreme short-term momentum.
Latest Candlestick Signal and Pre-Market Action
Friday’s daily candle was strongly bullish.
BE opened at $269.91, traded between $264.01 and $292.72, and closed at $288.70, in the top 14% of the day’s range.
The long candle body and relatively small upper shadow indicate buyers remained in control into the close.
Volume reached about 17.4 million shares, well above the roughly 10.6 million shares traded on September 22.
Pre-market trading on September 28 showed BE near $277, down about 4%.
That placed the stock below the midpoint of Friday’s candle body near $279.30.
If buyers reclaim that level and defend the $270 area, the bullish structure remains intact.
A close below that area on heavy volume would indicate that part of Friday’s surge is being sold.
Three Price Scenarios
Bullish continuation requires BE to hold $270, reclaim $282.56, and close above $292.72 on rising volume.
The first upside target would then be $304.57, followed by $325 to $335.
A weekly close above $300 would strengthen the case for a retest of the $351.28 high.
A sideways consolidation scenario would keep BE trading between roughly $256 and $293 while its moving averages catch up.
The low ADX reading and stretched distance above the moving averages are consistent with this scenario.
A bearish pullback would become more likely if BE closes below the $256 to $260 area.
That would expose the $230 to $246 support zone.
A close below roughly $203 would damage the long-term uptrend and materially change the technical outlook.
The article’s preferred near-term scenario is consolidation rather than either an immediate breakout or a major breakdown.
Fundamentals and Analyst Price Targets
Bloom Energy reported record second-quarter results on July 28, 2026.
Revenue reached $1.065 billion, up 166% from a year earlier, while product revenue increased 215%.
Gross margin rose to 33.4%, and GAAP operating income reached $182.2 million.
The company also raised its 2026 revenue guidance to $3.9 billion to $4.2 billion, representing about 100% growth at the midpoint.
Demand remains closely tied to AI data centers.
According to the article, TradingView’s summary links the outlook to data center deployments and the Oracle partnership, while RBC and BMO analysts have pointed to projects including Aligned Data Centers’ Project Phoenix and Oracle’s New Mexico site.
According to S&P Global data cited in the article, the average analyst price target is about $280.24, with a high of $390 and a low of $97.
Mizuho raised its target to $351 on September 14. RBC stands at $335, Clear Street at $330, UBS at $325, and Bernstein has a Hold rating with a $282 target.
The average analyst target sits close to the current share price, suggesting that a meaningful amount of positive news may already be reflected.
The next earnings report is estimated for around October 27, 2026.
Key Risks
BE has a beta near 3.8, meaning large price swings in either direction remain possible.
Legal headlines are another potential risk. Law firms have announced securities class actions alleging Bloom Energy understated its reliance on China-linked scandium. These remain allegations rather than findings.
The S&P 500 inclusion effect may also fade after index-related buying is completed.
Expectations are elevated after the stock’s sharp rally, while the current price is already slightly above the average analyst price target.
Late-October earnings also create event risk.
Conclusion
Bloom Energy’s chart shows a powerful long-term uptrend, a summer correction that held near the 200-day moving averages, and a strong recovery back toward $290.
The moving averages are stacked in bullish order, and TradingView’s overall technical rating is Strong Buy.
At the same time, BE trades far above several important moving averages, some short-term oscillators are approaching overbought territory, and pre-market weakness on September 28 points to early profit taking.
The first important support zone is $270 to $271, followed by $256 to $260 and then approximately $203.
Resistance sits at $292.72, $304.57, and the broader $325 to $351 zone.
The overall trend remains bullish, but the article favors near-term consolidation rather than chasing the rally at current levels.
Key levels to watch are whether BE holds $270, reclaims approximately $279.30 and $282.56, and eventually closes above $292.72 and $300.
This article is for educational and informational purposes only and is not financial, investment or trading advice. Technical analysis is based on past price behavior and does not guarantee future results. Prices, indicators and analyst targets change quickly, and the data here reflects TradingView and public sources through the September 25, 2026 close and pre-market trading on September 28. Trading stocks involves substantial risk, including the loss of your entire investment.
- BE closed at $288.70 on September 25, up 8.27%, with a strong bullish candle that finished near the top of its $264.01 to $292.72 session range.
- The long-term trend remains bullish. Shares are up 244.8% over one year, while 14 of 15 moving average signals on TradingView read Buy and none read Sell.
- Resistance sits at $292.72, $304.57, and the $325 to $351 zone that includes the 52-week high of $351.28.
- Support is concentrated around $270 to $271, $256 to $260, $230 to $246, and roughly $203, where the 200-day moving averages sit.
- Momentum remains positive but is not yet extreme. RSI is 62.80, MACD is 13.92 with a Buy signal, and Stochastic %K is 77.74, close to overbought territory.
- BE trades about 26% above its 50-day SMA and 42% above its 200-day SMA, which makes consolidation or a pullback possible even within a larger bullish trend.
- Pre-market trading on September 28 pointed to a decline of about 4% toward $277, putting the $270 support area in focus.
- TradingView’s overall technical summary reads Strong Buy, with 17 Buy, 9 Neutral, and 0 Sell signals. ADX at 16.42, however, suggests short-term trend strength remains modest.
BE Stock Trend Analysis
The one-year candlestick chart shows four distinct phases.
Base building (November to March): the stock moved sideways to higher in a broad range of roughly $80 to $180. Small, mixed candles showed buyers and sellers in balance.
Breakout and peak (April to June): a run of large green candles carried shares from the $170s to about $300, then to a peak near the 52-week high of $351.28. The tall red candle after the peak shows heavy profit taking.
Correction (July to August): BE gave back a large part of its gains and fell to roughly the $160 to $190 area, close to the 200-day averages near $203, where long-term buyers often step in.
Recovery (August to September): higher lows and a string of green candles pushed the stock back to about $289, near the $300 area where it traded for most of May and June.
The primary trend remains bullish. The intermediate trend is a recovery supported by higher lows, while the short-term trend is stretched after a roughly 35% monthly gain.
A weekly close above $300 would strengthen the continuation case. The larger resistance test remains the $330 to $351 zone.
Bloom Energy Stock Price Overview
BE closed September 25 at $288.70, up $22.05 or 8.27%.
The stock opened at $269.91, reached a session high of $292.72, and traded as low as $264.01.
Over one month, the stock gained $74.75, or 34.94%. Over one year, it gained $204.97, or 244.8%.
The 52-week high stands at $351.28.
BE has a beta of about 3.8, indicating that the stock has historically moved much more sharply than the broader market.
September strength followed confirmation that Bloom Energy joined the S&P 500, effective before the open on September 21.
Index inclusion can increase passive fund buying and market attention, but that effect can also fade once index-related buying is completed.
Support and Resistance Levels
The first resistance zone is $292.72 to $295, based on Friday’s session high and the nearby round-number area.
The next level is $304.57, corresponding to the Woodie R3 pivot and sitting just above the psychological $300 level.
Above that, $325 to $335 represents a broader resistance zone based on weekly highs reached during May and June.
Major resistance sits between $349.94 and $351.28. The Classic R3 pivot at $349.94 nearly overlaps the 52-week high of $351.28.
On the downside, $282.56 is an initial reference point. It corresponds to the Classic R2 and Fibonacci R3 pivot.
The first major support zone is $269.91 to $271.28, combining Friday’s opening price, the 10-day EMA at $271.16, and the 10-day SMA at $271.28.
Below that, $256.50 to $260.56 combines the 20-day SMA at $256.50, the 20-day EMA at $259.73, and the 20-day VWMA at $260.56.
A deeper support zone sits at $229.68 to $246.03, where the 50-day SMA, 50-day EMA, and Ichimoku base line at $239.33 are located.
Long-term support is concentrated around $202.96 to $204.15, where the 200-day SMA and EMA sit.
Moving Averages
TradingView tracks 15 moving average signals for BE.
Fourteen read Buy, one reads Neutral, and none read Sell, giving the group an overall Strong Buy rating.
The averages are also stacked in bullish order.
The 10-day EMA at $271.16 sits above the 20-day EMA at $259.73, which sits above the 50-day EMA at $246.03, which in turn sits above the 200-day EMA at $204.15.
The SMAs show the same general structure.
This alignment is consistent with a healthy uptrend because shorter-term prices are rising faster than longer-term prices.
However, BE is also significantly extended above those averages.
At $288.70, the stock trades about 6% above its 10-day SMA, 13% above its 20-day SMA, 26% above its 50-day SMA, and 42% above its 200-day SMA.
That degree of extension increases the probability of consolidation or a pullback toward the moving averages.
RSI, MACD and Momentum Indicators
TradingView lists 11 oscillators for BE, with 3 Buy, 8 Neutral, and 0 Sell signals.
RSI stands at 62.80. A reading above 50 indicates bullish momentum, while remaining below 70 means the stock is not yet in classic overbought territory.
MACD is 13.92 with a Buy signal, supporting the broader bullish momentum picture.
Momentum at 12.95 and Bull Bear Power at 21.75 also produce Buy signals.
Stochastic %K is 77.74, close to the 80 level usually associated with overbought conditions.
Williams %R is minus 9.21, a reading normally associated with overbought conditions, although TradingView still labels it Neutral.
CCI is 81.37, elevated but below the +100 level often associated with a stronger overbought push.
ADX is 16.42. A reading below 20 suggests that short-term trend strength remains relatively weak.
Stochastic RSI Fast stands at 24.29, indicating that shorter-term momentum has already cooled.
Taken together, the indicators show a bullish medium-term structure with warm but not extreme short-term momentum.
Latest Candlestick Signal and Pre-Market Action
Friday’s daily candle was strongly bullish.
BE opened at $269.91, traded between $264.01 and $292.72, and closed at $288.70, in the top 14% of the day’s range.
The long candle body and relatively small upper shadow indicate buyers remained in control into the close.
Volume reached about 17.4 million shares, well above the roughly 10.6 million shares traded on September 22.
Pre-market trading on September 28 showed BE near $277, down about 4%.
That placed the stock below the midpoint of Friday’s candle body near $279.30.
If buyers reclaim that level and defend the $270 area, the bullish structure remains intact.
A close below that area on heavy volume would indicate that part of Friday’s surge is being sold.
Three Price Scenarios
Bullish continuation requires BE to hold $270, reclaim $282.56, and close above $292.72 on rising volume.
The first upside target would then be $304.57, followed by $325 to $335.
A weekly close above $300 would strengthen the case for a retest of the $351.28 high.
A sideways consolidation scenario would keep BE trading between roughly $256 and $293 while its moving averages catch up.
The low ADX reading and stretched distance above the moving averages are consistent with this scenario.
A bearish pullback would become more likely if BE closes below the $256 to $260 area.
That would expose the $230 to $246 support zone.
A close below roughly $203 would damage the long-term uptrend and materially change the technical outlook.
The article’s preferred near-term scenario is consolidation rather than either an immediate breakout or a major breakdown.
Fundamentals and Analyst Price Targets
Bloom Energy reported record second-quarter results on July 28, 2026.
Revenue reached $1.065 billion, up 166% from a year earlier, while product revenue increased 215%.
Gross margin rose to 33.4%, and GAAP operating income reached $182.2 million.
The company also raised its 2026 revenue guidance to $3.9 billion to $4.2 billion, representing about 100% growth at the midpoint.
Demand remains closely tied to AI data centers.
According to the article, TradingView’s summary links the outlook to data center deployments and the Oracle partnership, while RBC and BMO analysts have pointed to projects including Aligned Data Centers’ Project Phoenix and Oracle’s New Mexico site.
According to S&P Global data cited in the article, the average analyst price target is about $280.24, with a high of $390 and a low of $97.
Mizuho raised its target to $351 on September 14. RBC stands at $335, Clear Street at $330, UBS at $325, and Bernstein has a Hold rating with a $282 target.
The average analyst target sits close to the current share price, suggesting that a meaningful amount of positive news may already be reflected.
The next earnings report is estimated for around October 27, 2026.
Key Risks
BE has a beta near 3.8, meaning large price swings in either direction remain possible.
Legal headlines are another potential risk. Law firms have announced securities class actions alleging Bloom Energy understated its reliance on China-linked scandium. These remain allegations rather than findings.
The S&P 500 inclusion effect may also fade after index-related buying is completed.
Expectations are elevated after the stock’s sharp rally, while the current price is already slightly above the average analyst price target.
Late-October earnings also create event risk.
Conclusion
Bloom Energy’s chart shows a powerful long-term uptrend, a summer correction that held near the 200-day moving averages, and a strong recovery back toward $290.
The moving averages are stacked in bullish order, and TradingView’s overall technical rating is Strong Buy.
At the same time, BE trades far above several important moving averages, some short-term oscillators are approaching overbought territory, and pre-market weakness on September 28 points to early profit taking.
The first important support zone is $270 to $271, followed by $256 to $260 and then approximately $203.
Resistance sits at $292.72, $304.57, and the broader $325 to $351 zone.
The overall trend remains bullish, but the article favors near-term consolidation rather than chasing the rally at current levels.
Key levels to watch are whether BE holds $270, reclaims approximately $279.30 and $282.56, and eventually closes above $292.72 and $300.
This article is for educational and informational purposes only and is not financial, investment or trading advice. Technical analysis is based on past price behavior and does not guarantee future results. Prices, indicators and analyst targets change quickly, and the data here reflects TradingView and public sources through the September 25, 2026 close and pre-market trading on September 28. Trading stocks involves substantial risk, including the loss of your entire investment.

Disclaimer
The information and publications are not meant to be, and do not constitute, financial, investment, trading, or other types of advice or recommendations supplied or endorsed by TradingView. Read more in the Terms of Use.
Disclaimer
The information and publications are not meant to be, and do not constitute, financial, investment, trading, or other types of advice or recommendations supplied or endorsed by TradingView. Read more in the Terms of Use.