
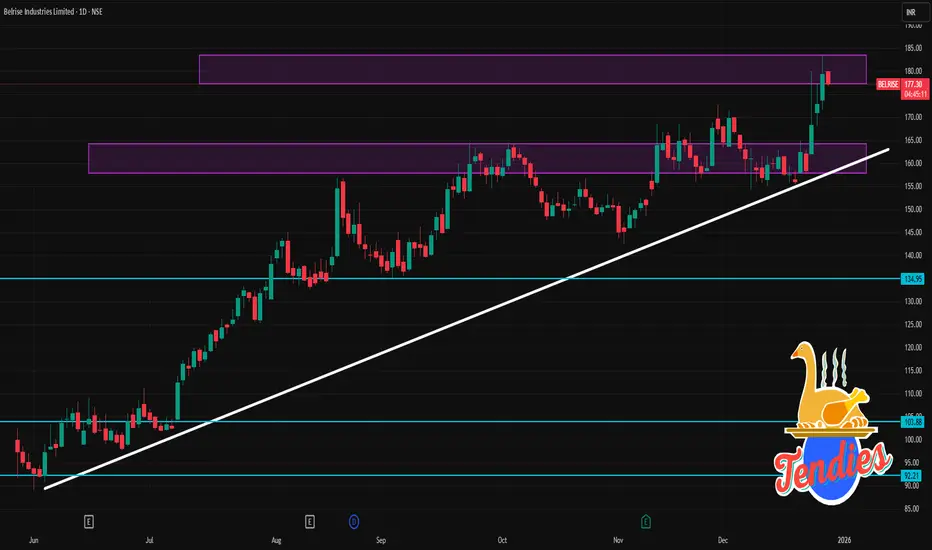
📈 Current Price Context
The stock is trading around ₹177-179 range recently.
📊 Daily Pivot & Levels (Important for intraday/day-trading)
Central Pivot (approx): ~ ₹178.17 (Daily pivot)
🔼 Resistance Levels
R1: ₹184.66
R2: ₹189.92
R3: ₹196.41
(These are daily resistance benchmarks where price may face selling pressure)
🔽 Support Levels
S1: ₹172.91
S2: ₹166.42
S3: ₹161.16
(These act as floor levels where price may find buying interest)
📍 These supports and resistances are typical pivot-based levels used by traders for intraday and next-day decision making.
📉 Additional Technical Zones
🟢 Bullish / Momentum Indicators
The stock’s RSI has been elevated (suggesting bullish momentum near overbought) around mid-60s to high-60s.
Moving averages (5-, 10-, 20-DMA) are below price, typically a bullish structure.
🟡 Volatility & Trend
ATR (Average True Range) suggests typical daily movement range ~ ₹7–8, useful to estimate realistic targets/stop levels.
🧠 Short-Term Intraday Strategy Notes (General Guidance)
Note: This is not financial advice—only common technical ideas traders use.
Bullish intraday view:
Long above pivot with stop just below S1, target R1/R2.
Bearish intraday view:
Short if price rejects resistance levels (R1/R2) with stop above next resistance.
Volatility play:
Expect moves within the ~₹172–185 range most of the day unless new news breaks (block deals, earnings, etc.).
The stock is trading around ₹177-179 range recently.
📊 Daily Pivot & Levels (Important for intraday/day-trading)
Central Pivot (approx): ~ ₹178.17 (Daily pivot)
🔼 Resistance Levels
R1: ₹184.66
R2: ₹189.92
R3: ₹196.41
(These are daily resistance benchmarks where price may face selling pressure)
🔽 Support Levels
S1: ₹172.91
S2: ₹166.42
S3: ₹161.16
(These act as floor levels where price may find buying interest)
📍 These supports and resistances are typical pivot-based levels used by traders for intraday and next-day decision making.
📉 Additional Technical Zones
🟢 Bullish / Momentum Indicators
The stock’s RSI has been elevated (suggesting bullish momentum near overbought) around mid-60s to high-60s.
Moving averages (5-, 10-, 20-DMA) are below price, typically a bullish structure.
🟡 Volatility & Trend
ATR (Average True Range) suggests typical daily movement range ~ ₹7–8, useful to estimate realistic targets/stop levels.
🧠 Short-Term Intraday Strategy Notes (General Guidance)
Note: This is not financial advice—only common technical ideas traders use.
Bullish intraday view:
Long above pivot with stop just below S1, target R1/R2.
Bearish intraday view:
Short if price rejects resistance levels (R1/R2) with stop above next resistance.
Volatility play:
Expect moves within the ~₹172–185 range most of the day unless new news breaks (block deals, earnings, etc.).

Contact Knowledgehub for a detailed consultation: Dm on WhatsApp: [wa.link/a2o0kz]-
Phone No: [+91 93102 26243]-
Email: [tradingviewknowledgehub@gmail.com]---
-- Let’s achieve success together!
Phone No: [+91 93102 26243]-
Email: [tradingviewknowledgehub@gmail.com]---
-- Let’s achieve success together!
Related publications
Disclaimer
The information and publications are not meant to be, and do not constitute, financial, investment, trading, or other types of advice or recommendations supplied or endorsed by TradingView. Read more in the Terms of Use.
Contact Knowledgehub for a detailed consultation: Dm on WhatsApp: [wa.link/a2o0kz]-
Phone No: [+91 93102 26243]-
Email: [tradingviewknowledgehub@gmail.com]---
-- Let’s achieve success together!
Phone No: [+91 93102 26243]-
Email: [tradingviewknowledgehub@gmail.com]---
-- Let’s achieve success together!
Related publications
Disclaimer
The information and publications are not meant to be, and do not constitute, financial, investment, trading, or other types of advice or recommendations supplied or endorsed by TradingView. Read more in the Terms of Use.