
Monthly Structure terms : Trendline, Flip Zone & Mother Candle
1. Monthly Timeframe
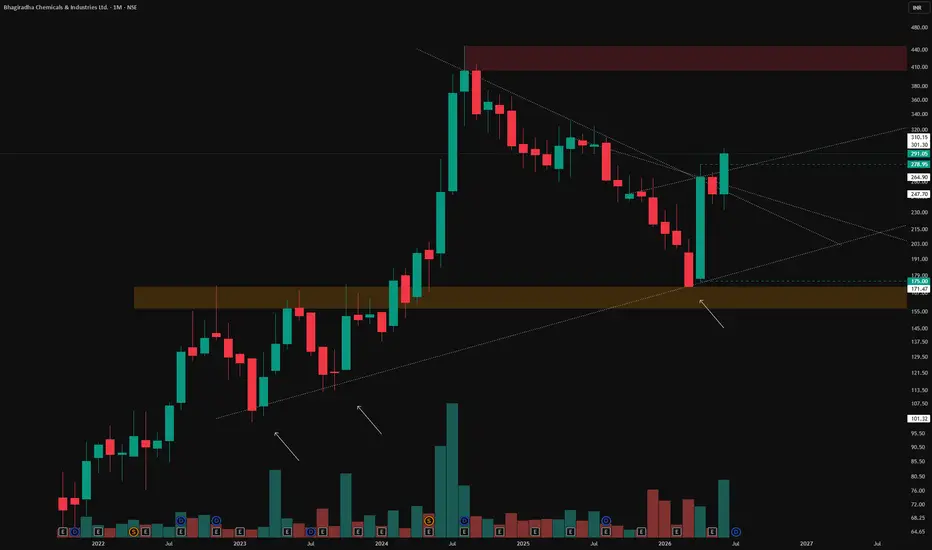
Each candle on this chart represents one full month of price action. The monthly timeframe filters out daily noise and shows the broader structural trend, making it the most reliable
2. The Trendline (White Line)
This trendline connects three genuine touches on the monthly chart, marked with arrows. Each touch shows price respecting the same rising support, confirming it as a valid, well-tested trendline rather than a randomly drawn line.
3. The Flip Zone (Orange Zone)
From 2022 to 2023, this zone acted as resistance, repeatedly capping price advances. In 2024, price broke out above it and sustained that breakout. Once broken and held, old resistance becomes new support, this is a textbook flip zone
4. The Supply Zone (Red Zone)
This marks the stock's all-time high, where aggressive selling pressure previously emerged. It remains an important zone to watch since price has not yet been tested or accepted above this level.
5. The Mother Candle & Inside Bars (Green Dotted Lines)
A mother candle is a large candle whose high and low range "contains" the next one or more candles, these contained candles are called inside bars. This pattern often signals consolidation or indecision before a potential expansion
Disclaimer: This post is for educational purposes only and is strictly non-forecasting and non-biased in nature. It does not constitute investment advice, a buy/sell recommendation, or a prediction of future price movement.
Each candle on this chart represents one full month of price action. The monthly timeframe filters out daily noise and shows the broader structural trend, making it the most reliable
2. The Trendline (White Line)
This trendline connects three genuine touches on the monthly chart, marked with arrows. Each touch shows price respecting the same rising support, confirming it as a valid, well-tested trendline rather than a randomly drawn line.
3. The Flip Zone (Orange Zone)
From 2022 to 2023, this zone acted as resistance, repeatedly capping price advances. In 2024, price broke out above it and sustained that breakout. Once broken and held, old resistance becomes new support, this is a textbook flip zone
4. The Supply Zone (Red Zone)
This marks the stock's all-time high, where aggressive selling pressure previously emerged. It remains an important zone to watch since price has not yet been tested or accepted above this level.
5. The Mother Candle & Inside Bars (Green Dotted Lines)
A mother candle is a large candle whose high and low range "contains" the next one or more candles, these contained candles are called inside bars. This pattern often signals consolidation or indecision before a potential expansion
Disclaimer: This post is for educational purposes only and is strictly non-forecasting and non-biased in nature. It does not constitute investment advice, a buy/sell recommendation, or a prediction of future price movement.

🏆 WHATSAPP ME : wa.me/919455664601
🏆 MY TELEGRAM : t.me/hashtaghammer
🏆 MY BOOK ( TRADING IS AN EMOTION ) : tinyurl.com/TradingISanEMOTION
🏆 MY TELEGRAM : t.me/hashtaghammer
🏆 MY BOOK ( TRADING IS AN EMOTION ) : tinyurl.com/TradingISanEMOTION
Related publications
Disclaimer
The information and publications are not meant to be, and do not constitute, financial, investment, trading, or other types of advice or recommendations supplied or endorsed by TradingView. Read more in the Terms of Use.
🏆 WHATSAPP ME : wa.me/919455664601
🏆 MY TELEGRAM : t.me/hashtaghammer
🏆 MY BOOK ( TRADING IS AN EMOTION ) : tinyurl.com/TradingISanEMOTION
🏆 MY TELEGRAM : t.me/hashtaghammer
🏆 MY BOOK ( TRADING IS AN EMOTION ) : tinyurl.com/TradingISanEMOTION
Related publications
Disclaimer
The information and publications are not meant to be, and do not constitute, financial, investment, trading, or other types of advice or recommendations supplied or endorsed by TradingView. Read more in the Terms of Use.