
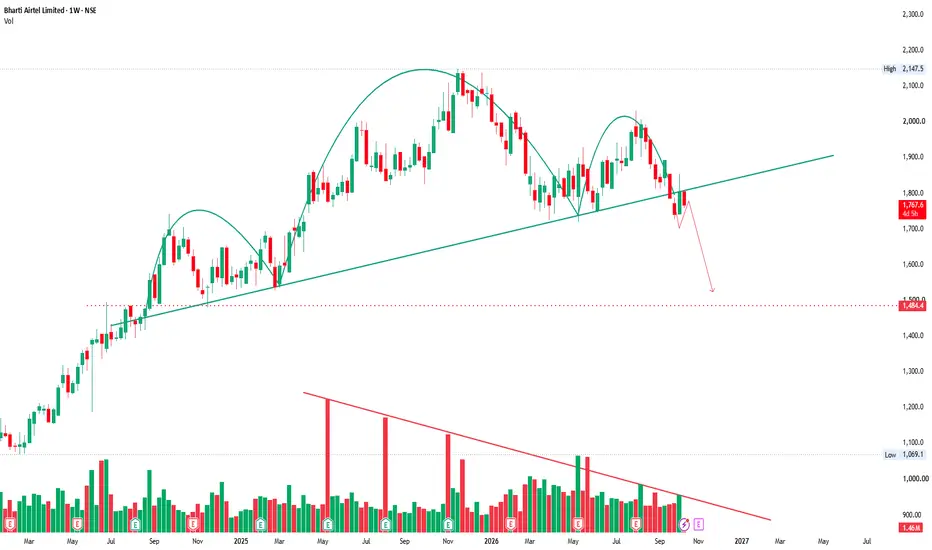
Bharti Airtel is approaching a critical technical juncture on the weekly chart.
After a strong multi-year rally, the stock has started losing momentum. The rising trendline that previously acted as dynamic support is now under pressure, with price trading around ₹1,768.
📉 The technical structure
The chart shows repeated rallies followed by corrections toward the rising trendline. However, the latest decline raises an important question: Is this another temporary pullback, or the beginning of a deeper correction?
🔴 Bearish scenario: If the stock fails to reclaim the trendline and selling pressure continues, the next major support I'm watching is around ₹1,485.
🟢 Recovery scenario: If buyers reclaim the broken trendline and establish a sustained move above the ₹1,800–₹1,850 zone, the breakdown thesis would need to be reassessed.
🧠 The telecom-sector angle
The sector's next phase increasingly depends on monetisation, not just subscriber growth.
Bharti Airtel recently announced a 3–10% increase in postpaid tariffs, effective October 2026, reflecting the industry's focus on higher-value customers and improved average revenue per user (ARPU).
Its Q1 FY27 consolidated revenue grew 18.4% year over year, while ARPU reached ₹264. The company's next quarterly results are scheduled tentatively for November 5, 2026.
This creates an interesting divergence: the business continues to show growth, but the chart is signalling technical weakness.
🎯 My levels to watch
• ₹1,700–₹1,750 — Immediate price-action zone
• ₹1,800–₹1,850 — Trendline-reclaim and recovery zone
• ₹1,485 — Major downside support marked on the chart
My view: I wouldn't assume the stock is a buy simply because it has corrected. I want to see whether the trendline is reclaimed or whether price confirms a breakdown.
A strong business and a weak chart can coexist. The key is to respect what price is telling us.
Will Airtel reclaim its long-term trendline, or is the market preparing for a deeper correction?
After a strong multi-year rally, the stock has started losing momentum. The rising trendline that previously acted as dynamic support is now under pressure, with price trading around ₹1,768.
📉 The technical structure
The chart shows repeated rallies followed by corrections toward the rising trendline. However, the latest decline raises an important question: Is this another temporary pullback, or the beginning of a deeper correction?
🔴 Bearish scenario: If the stock fails to reclaim the trendline and selling pressure continues, the next major support I'm watching is around ₹1,485.
🟢 Recovery scenario: If buyers reclaim the broken trendline and establish a sustained move above the ₹1,800–₹1,850 zone, the breakdown thesis would need to be reassessed.
🧠 The telecom-sector angle
The sector's next phase increasingly depends on monetisation, not just subscriber growth.
Bharti Airtel recently announced a 3–10% increase in postpaid tariffs, effective October 2026, reflecting the industry's focus on higher-value customers and improved average revenue per user (ARPU).
Its Q1 FY27 consolidated revenue grew 18.4% year over year, while ARPU reached ₹264. The company's next quarterly results are scheduled tentatively for November 5, 2026.
This creates an interesting divergence: the business continues to show growth, but the chart is signalling technical weakness.
🎯 My levels to watch
• ₹1,700–₹1,750 — Immediate price-action zone
• ₹1,800–₹1,850 — Trendline-reclaim and recovery zone
• ₹1,485 — Major downside support marked on the chart
My view: I wouldn't assume the stock is a buy simply because it has corrected. I want to see whether the trendline is reclaimed or whether price confirms a breakdown.
A strong business and a weak chart can coexist. The key is to respect what price is telling us.
Will Airtel reclaim its long-term trendline, or is the market preparing for a deeper correction?

Disclaimer
The information and publications are not meant to be, and do not constitute, financial, investment, trading, or other types of advice or recommendations supplied or endorsed by TradingView. Read more in the Terms of Use.
Disclaimer
The information and publications are not meant to be, and do not constitute, financial, investment, trading, or other types of advice or recommendations supplied or endorsed by TradingView. Read more in the Terms of Use.