
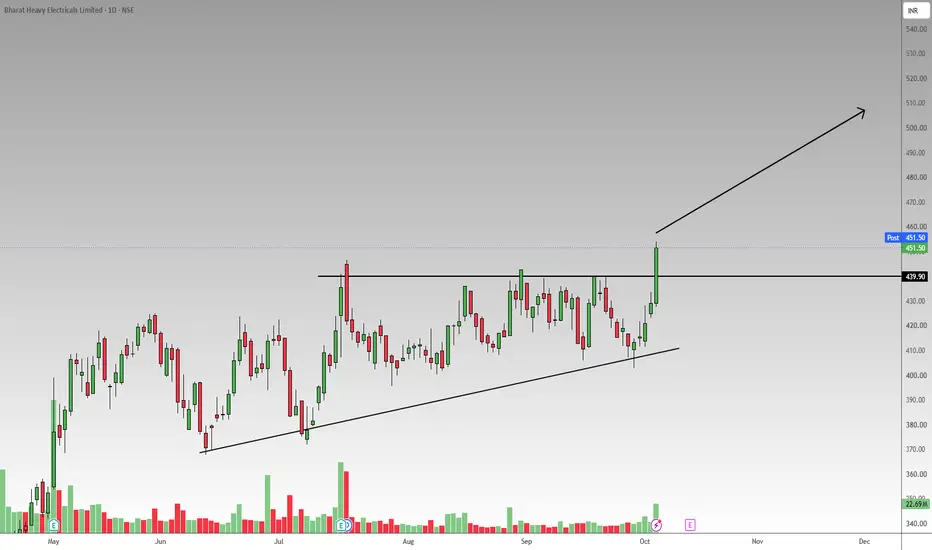
Based on the daily chart for Bharat Heavy Electricals Limited provided a clear bullish setup has materialized.
Technical Analysis & Reasoning:
Ascending Triangle Pattern: Since early June, the price action has steadily compressed, printing a series of higher lows along a well-defined, upward-sloping support trendline.
This accumulation pushed the price into a rigid horizontal resistance zone right at the 439.90 mark.
Confirmed Breakout: The most recent daily session resulted in a massive bullish candle that forcefully breached the 439.90 resistance, closing near its highs at 451.50.
Volume Confirmation: Using multiple analysis points as required, the breakout is accompanied by a noticeable surge in buying volume at the bottom of the chart, confirming the strength of the move and reducing the likelihood of a fake breakout.
Trade Setup:
Entry Point: Current Market Price of 451.50, or optimally accumulating on a minor retest of the broken 439.90–440.00 resistance level.
Target: 510.00. This is calculated using the measured move technique—taking the approximate 70-point height of the triangle pattern (from the ~370 base up to the 440 resistance) and projecting it upward from the breakout point.
Stop Loss: 420.00. A daily close below this level would slide back beneath the trendline and the breakout candle, invalidating the bullish pattern.
Technical Analysis & Reasoning:
Ascending Triangle Pattern: Since early June, the price action has steadily compressed, printing a series of higher lows along a well-defined, upward-sloping support trendline.
This accumulation pushed the price into a rigid horizontal resistance zone right at the 439.90 mark.
Confirmed Breakout: The most recent daily session resulted in a massive bullish candle that forcefully breached the 439.90 resistance, closing near its highs at 451.50.
Volume Confirmation: Using multiple analysis points as required, the breakout is accompanied by a noticeable surge in buying volume at the bottom of the chart, confirming the strength of the move and reducing the likelihood of a fake breakout.
Trade Setup:
Entry Point: Current Market Price of 451.50, or optimally accumulating on a minor retest of the broken 439.90–440.00 resistance level.
Target: 510.00. This is calculated using the measured move technique—taking the approximate 70-point height of the triangle pattern (from the ~370 base up to the 440 resistance) and projecting it upward from the breakout point.
Stop Loss: 420.00. A daily close below this level would slide back beneath the trendline and the breakout candle, invalidating the bullish pattern.
Trade closed: stop reached
Stoploss hit..
Disclaimer
The information and publications are not meant to be, and do not constitute, financial, investment, trading, or other types of advice or recommendations supplied or endorsed by TradingView. Read more in the Terms of Use.
Disclaimer
The information and publications are not meant to be, and do not constitute, financial, investment, trading, or other types of advice or recommendations supplied or endorsed by TradingView. Read more in the Terms of Use.