
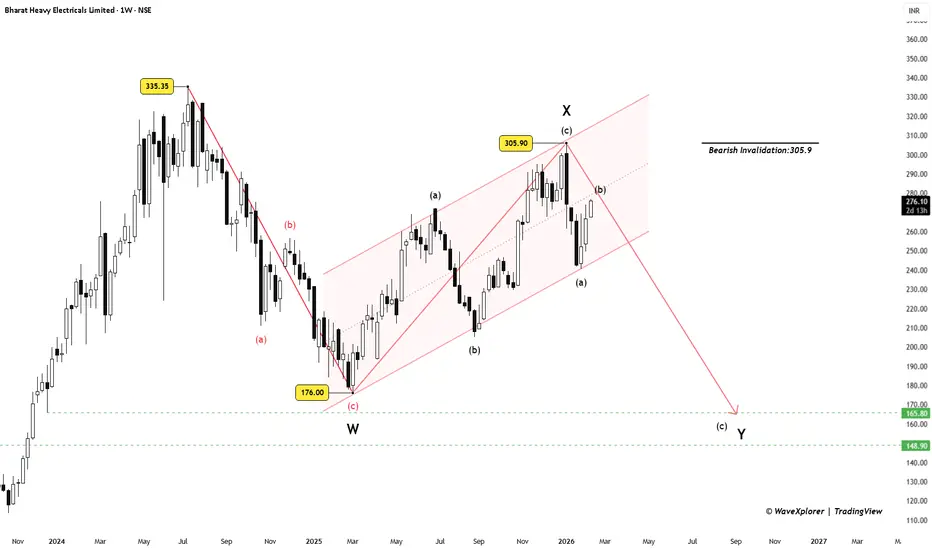
Big Picture (Weekly)
BHEL formed a bearish pole and flag on the weekly chart. After a sharp fall, price moved into a rising, overlapping channel — typical corrective behaviour.
Wave X looks completed near 305.9. As long as price stays below this level, the structure favours another leg down.
Zoom In (1H)

From 305.9 — 240.5, price unfolded in a clean ABC zigzag, marking (a) of Y.
The current rise is overlapping, slow, and wedge-shaped, suggesting a corrective (b) of Y, not a new trend.
Confluence to note:
A break below the lower wedge trendline is the trigger for the final (c) of Y decline.
Fundamentals Check

Fundamentals are not supporting upside here:
In short: price optimism > business reality.
Trade View
Bias: Bearish below 305.9
Entry:
Targets:
Invalidation:
Bottom Line
This is a classic case where structure, lower-timeframe signals, and fundamentals are aligned.
Until proven otherwise, rallies look corrective — not the start of a new bull run.
Disclaimer: This analysis is for educational purposes only and does not constitute investment advice. Please do your own research (DYOR) before making any trading decisions.
BHEL formed a bearish pole and flag on the weekly chart. After a sharp fall, price moved into a rising, overlapping channel — typical corrective behaviour.
Wave X looks completed near 305.9. As long as price stays below this level, the structure favours another leg down.
Zoom In (1H)
From 305.9 — 240.5, price unfolded in a clean ABC zigzag, marking (a) of Y.
The current rise is overlapping, slow, and wedge-shaped, suggesting a corrective (b) of Y, not a new trend.
Confluence to note:
- Rising wedge formation
- 0.618 retracement of the entire fall near ~280
- Momentum losing steam near resistance
A break below the lower wedge trendline is the trigger for the final (c) of Y decline.
Fundamentals Check
Fundamentals are not supporting upside here:
- P/E ~118 — wildly stretched for a PSU with low returns
- ROCE ~2–3% — weak capital efficiency
- Operating margins ~5.5% — thin and fragile
- Free cash flow = inconsistent — spikes, then collapses; not durable
- Debt increased sharply in the latest year
In short: price optimism > business reality.
Trade View
Bias: Bearish below 305.9
Entry:
- On a 1H breakdown below the rising wedge
Targets:
- 165 (primary)
- 150 (extended, if momentum expands)
Invalidation:
- Weekly close above 305.9 — bearish view fails
Bottom Line
This is a classic case where structure, lower-timeframe signals, and fundamentals are aligned.
Until proven otherwise, rallies look corrective — not the start of a new bull run.
Disclaimer: This analysis is for educational purposes only and does not constitute investment advice. Please do your own research (DYOR) before making any trading decisions.

WaveXplorer | Elliott Wave insights
📊 X profile: @veerappa89
📊 X profile: @veerappa89
Related publications
Disclaimer
The information and publications are not meant to be, and do not constitute, financial, investment, trading, or other types of advice or recommendations supplied or endorsed by TradingView. Read more in the Terms of Use.
WaveXplorer | Elliott Wave insights
📊 X profile: @veerappa89
📊 X profile: @veerappa89
Related publications
Disclaimer
The information and publications are not meant to be, and do not constitute, financial, investment, trading, or other types of advice or recommendations supplied or endorsed by TradingView. Read more in the Terms of Use.