
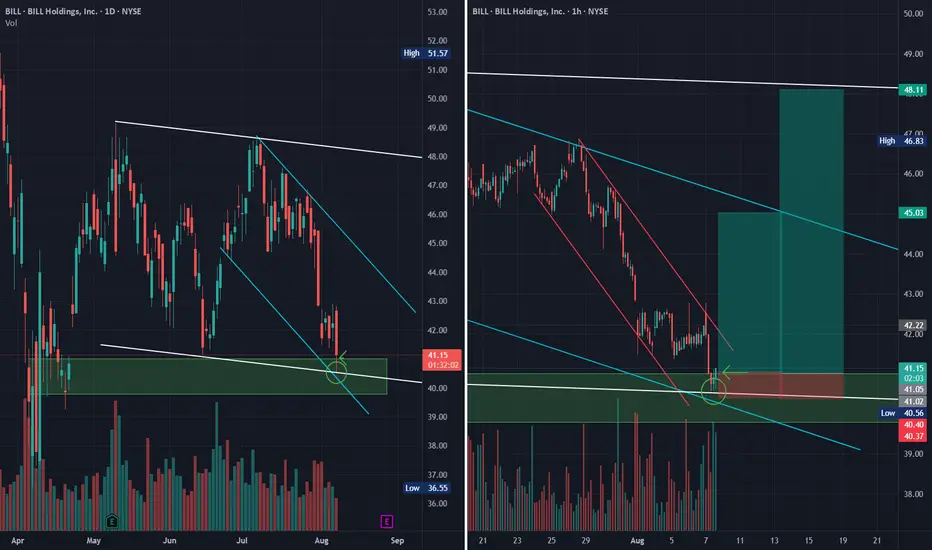
Here is a multi-time frame analysis and trade idea on BILL. The algorithms are indicating a potential short-term reversal and with a few of our confluences and confirmations, we are able to set up a solid trade.
I left out the weekly view because it's not as relevant for this short-term trade idea - but needless to say, we are in a strong downtrend.
As you'll see on the Daily (left chart), we are respecting a tapered white selling algorithm on the buy-side and potentially proving it on the sell-side today. If this is the case, we have the opportunity to take the trade from the bottom of white to at minimum the top of the stronger teal selling channel.
- Trade 1 is offering a 6 R:R (to the top of teal)
- Trade 2 is offering a 10 R:R (to the top of white)
Keep in mind that if we do break out of teal and prove white on the daily time frame, this would be a very bullish indication and potentially leave us for a breakout trade beyond toward the top of the weekly selling channel.
The major confluence that makes this trade viable is the HTF demand zone (indicated by the green box) that we have just tapped into. While the perfect entry would be on a white hold which we had at today's low of $40.60, for further confirmation, we are waiting for a break and 15 Minute close above the demand zone. We will then enter the position and have a tight stop below our white algorithm and low of day.
If you like this type of analysis and trade ideas, let me know in the comments! I typically post longer-form analysis videos which offer more information and give you the ability to find trades on your own. However, I am happy to offer ideas like these when a good opportunity arises
Happy Trading :)
Trade active
15 minutes after this post we had an entry opportunity with a 15M close above the zone.
We gapped up today right near our lower time frame strong selling red and are looking to build further downside liquidity for a breakout there toward teal.
Trade closed: stop reached
After a rejection of our LTF red selling, it proved to be in control and we've since stopped out on a drop below our tapered teal and white. We are now stuck in a strong selling algorithm both on the lower and higher time frames. We will leave this chart be until further price action gives us an opportunity!

Weekly 'In the Trades' Newsletter - My favorite tradable setups right to your inbox!
betweenthetrades.substack.com
betweenthetrades.substack.com
Disclaimer
The information and publications are not meant to be, and do not constitute, financial, investment, trading, or other types of advice or recommendations supplied or endorsed by TradingView. Read more in the Terms of Use.