
⏱️ Reading Time: ~3 minutes
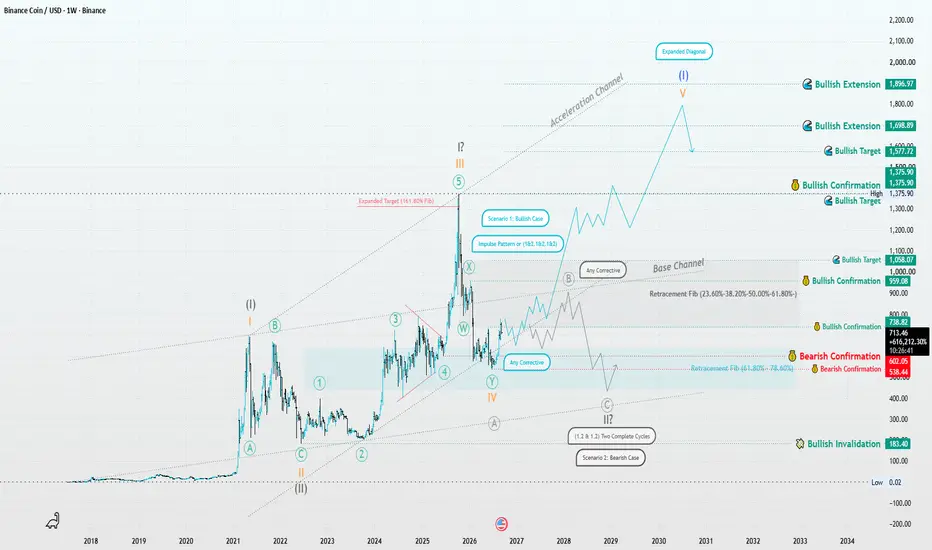
The weekly BNB chart, shown on a Linear scale rather than a logarithmic scale, is at a point where the larger structure still does not give us a definitive answer. However, two very different paths can be followed from the structure currently developing.
The key question here is not simply whether BNB will go up or down. The more important question is whether the current move is building a new impulsive wave or is still part of a larger corrective structure.
🟦 Scenario 1 | Bullish Case
In the aggressive scenario, the previous structure may represent a completed cycle, with the recent decline marking the end of Wave IV.
If this interpretation is correct, the new advance could be developing as Wave V.
But the key is not simply seeing price rise. The internal structure of the move matters more. To strengthen this scenario, we would want to see the advance gradually develop into a clear and valid impulsive structure.
The $959 area is the first important confirmation level, while a move above $1,058 could add further strength to the bullish case.
However, $1,375 is particularly important. A valid break above this area could increase the probability that Wave V is continuing and bring the higher targets of $1,577 → $1,699 → $1,897 into focus.
Higher on the chart, a possible Expanded Diagonal is also outlined. So even within the bullish scenario, the shape and internal structure of the move matter; simply reaching a price target would not, by itself, confirm the wave count.
⚫ Scenario 2 | Bearish Case
But what if the current advance fails to develop into a valid impulsive structure?
Then another interpretation comes into play.
The current rise could still be part of a Corrective Structure, potentially followed by another advance before the market enters a larger decline.
Under this scenario, the larger structure could be interpreted as two nested 1–2 cycles, meaning the market may still need lower prices to complete the broader correction.
In this path, $602 and then $538 become important bearish confirmation levels.
At the same time, $183.40 is marked on the chart as the Bullish Invalidation level. So until the structure reaches that area, the bullish interpretation should not be dismissed simply because of a short-term correction.
🔎 What Matters Now?
For me, the most important part of this chart is not the final target — it is how price behaves between these levels.
If BNB can move through the confirmation levels and build a complete bullish structure, the Wave V scenario gains strength.
But if the price fails to develop an impulsive advance and breaks the $602 → $538 support zone, the probability of a larger correction increases.
For now, the market needs to prove itself.
Structure first. Price action decides the scenario.
— Patterns whisper. I listen. – Mr. Nobody 🎧📊
Binance Coin
Dec 15, 2023
Continue Bullish Market
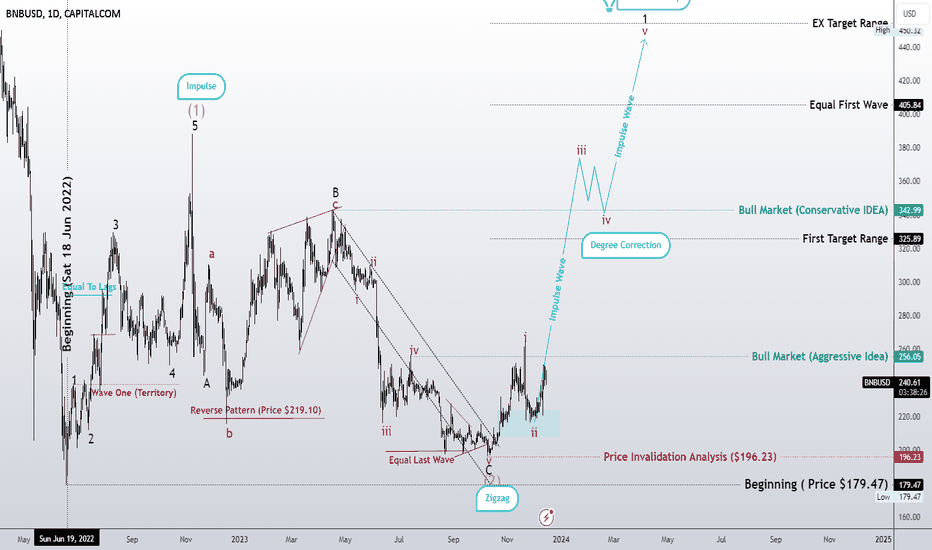
The weekly BNB chart, shown on a Linear scale rather than a logarithmic scale, is at a point where the larger structure still does not give us a definitive answer. However, two very different paths can be followed from the structure currently developing.
The key question here is not simply whether BNB will go up or down. The more important question is whether the current move is building a new impulsive wave or is still part of a larger corrective structure.
🟦 Scenario 1 | Bullish Case
In the aggressive scenario, the previous structure may represent a completed cycle, with the recent decline marking the end of Wave IV.
If this interpretation is correct, the new advance could be developing as Wave V.
But the key is not simply seeing price rise. The internal structure of the move matters more. To strengthen this scenario, we would want to see the advance gradually develop into a clear and valid impulsive structure.
The $959 area is the first important confirmation level, while a move above $1,058 could add further strength to the bullish case.
However, $1,375 is particularly important. A valid break above this area could increase the probability that Wave V is continuing and bring the higher targets of $1,577 → $1,699 → $1,897 into focus.
Higher on the chart, a possible Expanded Diagonal is also outlined. So even within the bullish scenario, the shape and internal structure of the move matter; simply reaching a price target would not, by itself, confirm the wave count.
⚫ Scenario 2 | Bearish Case
But what if the current advance fails to develop into a valid impulsive structure?
Then another interpretation comes into play.
The current rise could still be part of a Corrective Structure, potentially followed by another advance before the market enters a larger decline.
Under this scenario, the larger structure could be interpreted as two nested 1–2 cycles, meaning the market may still need lower prices to complete the broader correction.
In this path, $602 and then $538 become important bearish confirmation levels.
At the same time, $183.40 is marked on the chart as the Bullish Invalidation level. So until the structure reaches that area, the bullish interpretation should not be dismissed simply because of a short-term correction.
🔎 What Matters Now?
For me, the most important part of this chart is not the final target — it is how price behaves between these levels.
If BNB can move through the confirmation levels and build a complete bullish structure, the Wave V scenario gains strength.
But if the price fails to develop an impulsive advance and breaks the $602 → $538 support zone, the probability of a larger correction increases.
For now, the market needs to prove itself.
Structure first. Price action decides the scenario.
— Patterns whisper. I listen. – Mr. Nobody 🎧📊
Binance Coin
Dec 15, 2023
Continue Bullish Market

Related publications
Disclaimer
The information and publications are not meant to be, and do not constitute, financial, investment, trading, or other types of advice or recommendations supplied or endorsed by TradingView. Read more in the Terms of Use.
Related publications
Disclaimer
The information and publications are not meant to be, and do not constitute, financial, investment, trading, or other types of advice or recommendations supplied or endorsed by TradingView. Read more in the Terms of Use.