
📊
1. Main Trend
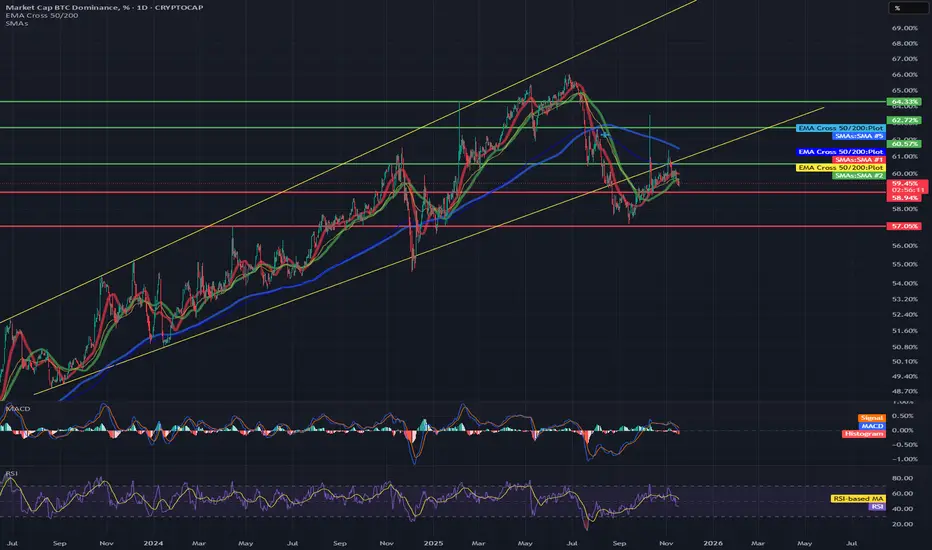
BTC.D is still moving within a large, ascending trend channel (yellow lines).
The price has currently rebounded from the lower band of the channel and is heading towards its center.
The long-term trend remains bullish, but short-term momentum is weakening.
📈 Key Levels on the Chart
Supports
59.20% – currently tested support + EMA 50 and SMA 50
→ a very important level. Its loss = downward pressure on BTC.D, favorable for altcoins.
58.24% – next strong support level
→ if 59.20% falls, a move to 58.24% is very likely.
57.05% – key structural support
→ breakout = the ascending trend is broken, altcoin season is off to a strong start.
Resistance
60.87% – local resistance from multiple candles + MA/EMA crossover
61.65% – strong upside target
64.68% – trend extreme (upper band of the channel)
→ if BTC moves solo, this level will be tested.
🔵 EMA / SMA 50/200
I can see a few key things in the screenshot:
The 50 EMA is below the 200 EMA – technically a death cross → a short-term bearish structure.
The price is exactly below the 200 EMA and stuck to the 50 EMA.
→ this is a typical consolidation zone before a breakout.
Conclusion:
If BTC.D breaks 60.8% → momentum returns to BTC's side.
If it falls below 59.20% → altcoins receive a signal to rebound.
🔴 MACD
The MACD is above 0, but the crossing line is bearish (the blue line crosses the signal from above).
The histogram turns red.
Conclusion:
Momentum is decreasing → a short-term bearish signal.
🟣 RSI
RSI is around 53, which is neutral.
A downward breakout of the MA onto the RSI → a weakening impulse.
Conclusion:
The RSI does not support a strong move either up or down — but the slight slope suggests a correction.
📌 SCENARIOS
🟢 Bullish (pro-BTC)
Condition: 60.8% breakout
➡️ Targets:
61.6%
64.6% (channel top)
This means:
➡️ BTC dominates the market
➡️ ALTs are bleeding or stagnating
🔴 Bearish (pro-alts)
Condition: 59.20% breakout
➡️ Bearish targets:
58.24%
57.05% → and this is where the real alt season begins
This means:
➡️ Alts are starting to pump harder
➡️ BTC is losing dominance
🟡 Neutral / sideway
BTC.D between 59.2% and 60.8%
→ range consolidation, lack of major market decision
→ typical for periods when the entire crypto market stands still and "waits"
1. Main Trend
BTC.D is still moving within a large, ascending trend channel (yellow lines).
The price has currently rebounded from the lower band of the channel and is heading towards its center.
The long-term trend remains bullish, but short-term momentum is weakening.
📈 Key Levels on the Chart
Supports
59.20% – currently tested support + EMA 50 and SMA 50
→ a very important level. Its loss = downward pressure on BTC.D, favorable for altcoins.
58.24% – next strong support level
→ if 59.20% falls, a move to 58.24% is very likely.
57.05% – key structural support
→ breakout = the ascending trend is broken, altcoin season is off to a strong start.
Resistance
60.87% – local resistance from multiple candles + MA/EMA crossover
61.65% – strong upside target
64.68% – trend extreme (upper band of the channel)
→ if BTC moves solo, this level will be tested.
🔵 EMA / SMA 50/200
I can see a few key things in the screenshot:
The 50 EMA is below the 200 EMA – technically a death cross → a short-term bearish structure.
The price is exactly below the 200 EMA and stuck to the 50 EMA.
→ this is a typical consolidation zone before a breakout.
Conclusion:
If BTC.D breaks 60.8% → momentum returns to BTC's side.
If it falls below 59.20% → altcoins receive a signal to rebound.
🔴 MACD
The MACD is above 0, but the crossing line is bearish (the blue line crosses the signal from above).
The histogram turns red.
Conclusion:
Momentum is decreasing → a short-term bearish signal.
🟣 RSI
RSI is around 53, which is neutral.
A downward breakout of the MA onto the RSI → a weakening impulse.
Conclusion:
The RSI does not support a strong move either up or down — but the slight slope suggests a correction.
📌 SCENARIOS
🟢 Bullish (pro-BTC)
Condition: 60.8% breakout
➡️ Targets:
61.6%
64.6% (channel top)
This means:
➡️ BTC dominates the market
➡️ ALTs are bleeding or stagnating
🔴 Bearish (pro-alts)
Condition: 59.20% breakout
➡️ Bearish targets:
58.24%
57.05% → and this is where the real alt season begins
This means:
➡️ Alts are starting to pump harder
➡️ BTC is losing dominance
🟡 Neutral / sideway
BTC.D between 59.2% and 60.8%
→ range consolidation, lack of major market decision
→ typical for periods when the entire crypto market stands still and "waits"

Disclaimer
The information and publications are not meant to be, and do not constitute, financial, investment, trading, or other types of advice or recommendations supplied or endorsed by TradingView. Read more in the Terms of Use.
Disclaimer
The information and publications are not meant to be, and do not constitute, financial, investment, trading, or other types of advice or recommendations supplied or endorsed by TradingView. Read more in the Terms of Use.