
₿ | Bitcoin Price Analysis | Breakdown Or Recovery?
⚡ Bitcoin is at a critical decision zone!
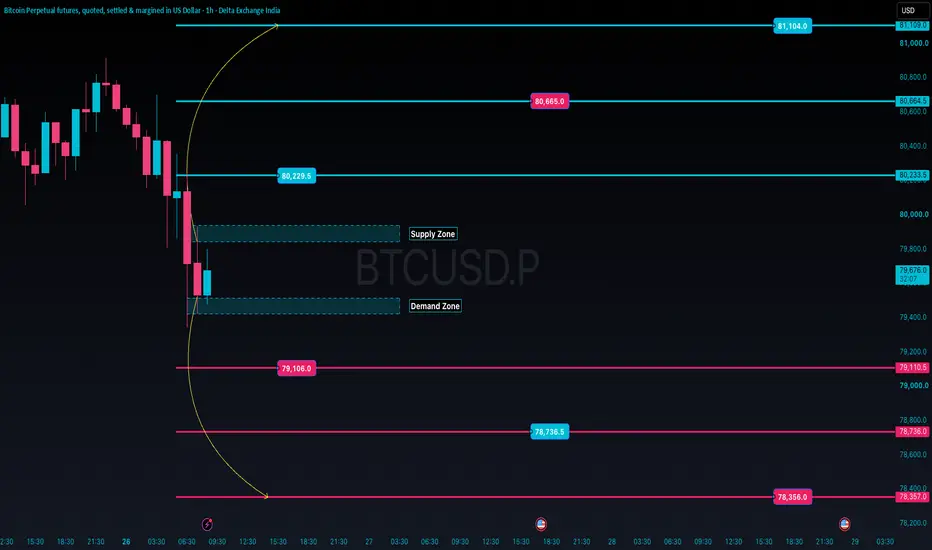
Bitcoin has faced strong selling pressure on the 1-hour chart, moving from the $80,000 region toward the $79,400–$79,600 demand area.
The latest candle shows a modest bounce, but is this the beginning of a recovery—or just a temporary pause before another leg lower? 👀
Let's decode the important Bitcoin support and resistance levels, supply and demand zones, and potential trading scenarios. 🔍
📉 1. WHAT IS THE BTCUSD 1-HOUR CHART TELLING US?
The current structure shows:
🔴 Bearish momentum: A sequence of declining candles indicates that sellers have been in control.
🟡 Demand zone test: Price is approaching an area where buyers may attempt to defend the market.
🔵 Supply zone overhead: A recovery could encounter selling pressure near the previous breakdown area.
⚠️ Key insight: A bounce from demand does not automatically confirm a trend reversal. We need to see whether buyers can reclaim resistance and establish a higher low.
📍 2. BITCOIN KEY SUPPORT & RESISTANCE LEVELS
🟢 Potential Support Zones
🔹 $79,400–$79,500 — Immediate demand zone
🔹 $79,110 — First major downside reference
🔹 $78,736 — Next support reference
🔹 $78,357 — Lower downside reference
🔴 Potential Resistance Zones
🔸 $79,800–$79,930 — Immediate supply zone
🔸 $80,233 — First major resistance
🔸 $80,665 — Higher resistance
🔸 $81,109 — Major upside reference
📌 These levels are taken from the attached chart and should be rechecked against live price action before trading.
🐻 3. BEARISH SCENARIO — WILL BITCOIN BREAK DEMAND?
If BTCUSD fails to sustain the current demand zone, bearish continuation becomes a possibility.
🔻 Price breaks below the $79,400–$79,500 demand area.
🔻 A 1-hour candle closes below the zone, followed by a failed retest.
🎯 Potential downside reference levels:
➡️ $79,110
➡️ $78,736
➡️ $78,357
💡 Trading insight: A breakdown followed by a failed retest can provide stronger confirmation than selling directly into support.
⚠️ If price is already falling sharply, avoid chasing the move. Wait for a structured setup and define risk before entering.
🐂 4. BULLISH SCENARIO — CAN BUYERS STAGE A RECOVERY?
The bullish case requires evidence that buyers are regaining control.
🟢 Price holds the demand zone.
🟢 BTCUSD reclaims the $79,800–$79,930 supply zone.
🟢 A successful retest or a higher low supports the recovery.
🎯 Potential upside reference levels:
➡️ $80,233
➡️ $80,665
➡️ $81,109
🚀 Super-confirmation: Look for a sustained reclaim of the supply zone, improving price structure and bullish follow-through. A brief upward spike alone is not enough.
🧠 5. THE SMART TRADER'S CHECKLIST
Before considering any Bitcoin trade, ask yourself:
✅ Is the market trending or consolidating?
✅ Has price confirmed a breakout or breakdown?
✅ Is the entry near a meaningful support or resistance level?
✅ Where is the setup invalidated?
✅ Does the potential reward justify the risk?
✅ Have you accounted for leverage, funding costs, spreads and volatility?
❌ Never assume that a support zone must hold.
❌ Never enter simply because Bitcoin looks cheap.
❌ Never increase leverage to recover a previous loss.
💎 6. THE BIGGEST LESSON FROM THIS CHART
The market does not reward prediction alone. It rewards disciplined decision-making.
📉 Below demand: Watch for confirmed bearish continuation.
📈 Above reclaimed supply: Watch for evidence of a recovery.
⏳ Between the zones: Patience may be the best position.
The objective is not to predict every candle. It is to identify meaningful levels, wait for confirmation and manage risk when the market behaves differently than expected.
🔥 BITCOIN TRADERS, WHAT'S YOUR VIEW?
Where do you think BTCUSD is heading next? 👇
🐻 BEARISH: Demand breaks, and Bitcoin moves toward lower support.
🐂 BULLISH: Buyers defend demand and reclaim the supply zone.
🟡 WAIT & WATCH: Let the market confirm its next move.
💬 Comment BEARISH, BULLISH or WAIT and share the level you are watching!
🔔 Follow Globus Capitas for more Bitcoin price analysis, BTCUSD technical analysis, crypto trading education, support and resistance levels, and practical market breakdowns.
📊 Read the Chart. Respect the Levels. Trade with Discipline.
⚠️ Educational analysis only, based on the supplied BTCUSD 1-hour chart. These are conditional scenarios, not guaranteed price targets or personalised trading recommendations. Cryptocurrency perpetual futures carry substantial risk, especially when leverage is used.
❤️ Market Wisdom to Remember: ❤️
⭐ Trade what you see, not what you assume
⭐ Follow the trend — it's your only true friend
⭐ The chart tells the real story — trust it
⭐ Emotions & assumptions have no place in trading
⭐ Capital protection comes first — always
At Globus Capitas, our mission is to empower individuals globally with the knowledge and skills needed to navigate financial markets confidently and work towards achieving their financial goals. 💪
🚫 Disclaimer: The information provided is purely educational. No buy/sell recommendations. Always do your own research, assess your risk tolerance, and consult a financial advisor before making any investment decisions. We are not responsible for any profit or loss.
💡 Your support matters! Like, comment, and follow to stay updated and motivated.
Cheers & Trade Smart! 🚀
Note
Note
Trade closed: target reached
All Targets Done 👍

Disclaimer
The information and publications are not meant to be, and do not constitute, financial, investment, trading, or other types of advice or recommendations supplied or endorsed by TradingView. Read more in the Terms of Use.
Disclaimer
The information and publications are not meant to be, and do not constitute, financial, investment, trading, or other types of advice or recommendations supplied or endorsed by TradingView. Read more in the Terms of Use.