
Hello
It's a Bitcoin Guide.
If you "follow"
You can receive real-time movement paths and comment notifications on major sections.
If my analysis was helpful,
Please click the booster button at the bottom.

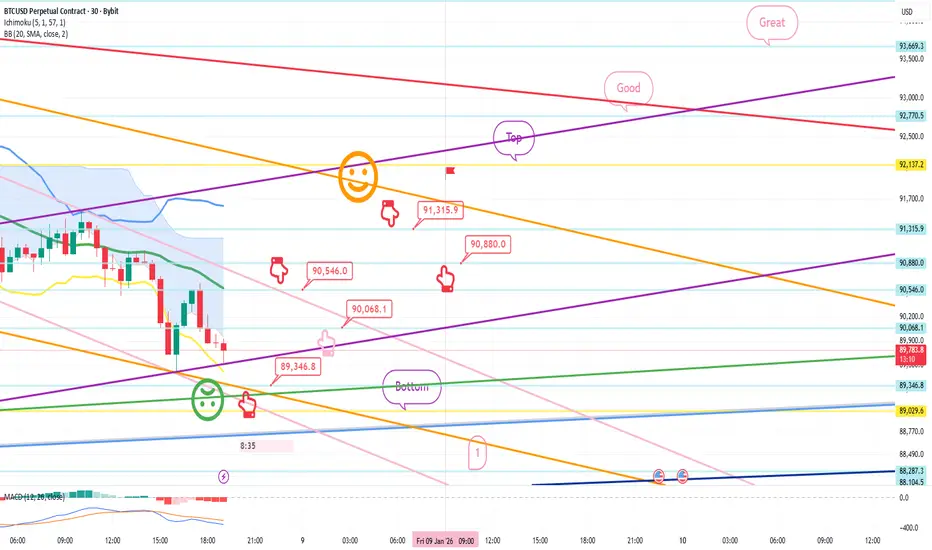
This is Bitcoin's 30-minute chart.
The Nasdaq indicator will be released shortly at 10:30 AM.
*When the red finger moves,
this is a one-way long position strategy.
1. $89,346.8 is the entry point for a long position.
Stop-loss price is set when the green support line is broken.
(It must be touched before 9 PM,
to complete the 6+12 pattern and trigger an uptrend.)
2. I've marked the wave path with the finger in the middle.
The short-term target price is $90,546 -> $91,516.9.
After re-entering the long position at $90,880,
the target price is in order from Top -> Good -> Great.
If it touches the bottom today,
the mid-term pattern will be broken again,
creating the possibility of further declines. Please be careful.
The bottom section is connected to the uptrend line, so it's best to maintain a long position.
The bottom section is open up to section 1.
Please note that my analysis up to this point is for reference only.
I hope you operate safely, with a clear focus on principled trading and stop-loss orders.
Thank you.
It's a Bitcoin Guide.
If you "follow"
You can receive real-time movement paths and comment notifications on major sections.
If my analysis was helpful,
Please click the booster button at the bottom.
This is Bitcoin's 30-minute chart.
The Nasdaq indicator will be released shortly at 10:30 AM.
*When the red finger moves,
this is a one-way long position strategy.
1. $89,346.8 is the entry point for a long position.
Stop-loss price is set when the green support line is broken.
(It must be touched before 9 PM,
to complete the 6+12 pattern and trigger an uptrend.)
2. I've marked the wave path with the finger in the middle.
The short-term target price is $90,546 -> $91,516.9.
After re-entering the long position at $90,880,
the target price is in order from Top -> Good -> Great.
If it touches the bottom today,
the mid-term pattern will be broken again,
creating the possibility of further declines. Please be careful.
The bottom section is connected to the uptrend line, so it's best to maintain a long position.
The bottom section is open up to section 1.
Please note that my analysis up to this point is for reference only.
I hope you operate safely, with a clear focus on principled trading and stop-loss orders.
Thank you.
Trade closed: target reached
Hello,It's a Bitcoin Guide.
I'll check the movement since writing the analysis on January 8th.
This is a 30-minute Bitcoin chart.
I've marked key areas with black fingers.
*In the red finger long position strategy,
after entering a long position at $89,346.8 in the lower left corner,
the green support line remained intact,
breaking through the pink resistance line -> hitting the target price of $91,315.9 at the top.
From Friday, when no analysis was conducted, through the weekend,
the price moved sideways, maintaining the green support line,
but perfectly reaching the final target price at the top of the upper range.
The strategy was a perfect take-profit.
After entering the long position, it rose around $3,000,
and then began a strong correction.
As indicated, it appears that a reversal occurred in the Gap7 area that occurred over the weekend.
I hope you continue to operate with a disciplined trading style for the remainder of the trading period.
Thank you.
Note
Hello,It's a Bitcoin Guide.
After writing the analysis on January 8th,
I only provided the plotted range on the 12th.
Let's check out the movement after that.
s3.tradingview.com/snapshots/g/gYTfcuL2.png
Before the movement,
Bitcoin 1-hour chart real-time plotted range
This is the Bitcoin 1-hour chart.
I've marked the key ranges with black fingers.
At the bottom left, with a purple finger,
I've used the same strategy as the long position entry point on January 8th, at $89,346.8.
As you can see,
without breaking away from the purple support line I've drawn,
the long position target price remains at the top.
The price is rising from the Top -> Good -> Great range to $96,366.3,
around $7,300.
As I explained last time,
the general movement is expected,
but I'll break it down.
Thank you.

[Bitcoin Guide Affiliate]
*Bybit 20%DC Lifetime + $30,100
partner.bybit.com/b/Bitcoin_Guide
*BingX 50%DC + $14,100
bit.ly/3E8ZkAW
*ZeroMarket ECN 40%DC
bit.ly/3pY0dUv
*Telegram
t.me/bitcoinguide_TM
*Bybit 20%DC Lifetime + $30,100
partner.bybit.com/b/Bitcoin_Guide
*BingX 50%DC + $14,100
bit.ly/3E8ZkAW
*ZeroMarket ECN 40%DC
bit.ly/3pY0dUv
*Telegram
t.me/bitcoinguide_TM
Related publications
Disclaimer
The information and publications are not meant to be, and do not constitute, financial, investment, trading, or other types of advice or recommendations supplied or endorsed by TradingView. Read more in the Terms of Use.
[Bitcoin Guide Affiliate]
*Bybit 20%DC Lifetime + $30,100
partner.bybit.com/b/Bitcoin_Guide
*BingX 50%DC + $14,100
bit.ly/3E8ZkAW
*ZeroMarket ECN 40%DC
bit.ly/3pY0dUv
*Telegram
t.me/bitcoinguide_TM
*Bybit 20%DC Lifetime + $30,100
partner.bybit.com/b/Bitcoin_Guide
*BingX 50%DC + $14,100
bit.ly/3E8ZkAW
*ZeroMarket ECN 40%DC
bit.ly/3pY0dUv
*Telegram
t.me/bitcoinguide_TM
Related publications
Disclaimer
The information and publications are not meant to be, and do not constitute, financial, investment, trading, or other types of advice or recommendations supplied or endorsed by TradingView. Read more in the Terms of Use.