
Hello
It's a Bitcoin Guide.
If you "follow"
You can receive real-time movement paths and comment notifications on major sections.
If my analysis was helpful,
Please click the booster button at the bottom.

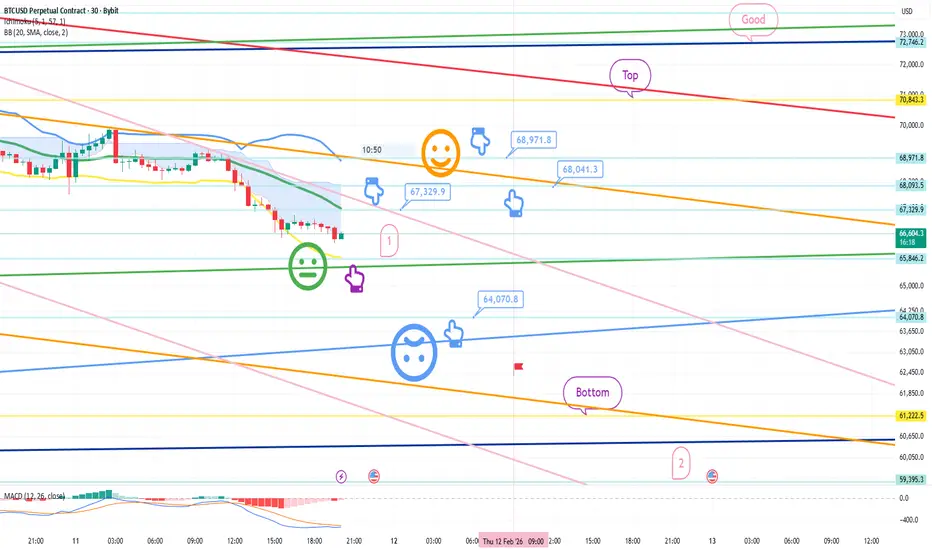
This is Bitcoin's 30-minute chart.
The Nasdaq indicators will be released shortly at 10:30 AM.
*When the light blue finger moves,
this is a two-way neutral strategy: switching from short to long or holding long.
1. After touching the purple finger once at the bottom,
the light blue finger at the top indicates a short position entry point at $67,329.9.
/ Stop-loss price if the orange resistance line is broken.
2. Switch to a long position at $64,070.8. / Stop-loss price if the light blue support line is broken.
3. $68,971.8: First target for a long position -> Target price in the order of Top and Good.
The middle price of $68,041.3 can be used as a long position re-entry point.
If the first point is immediately pushed back from the current position,
this is a final long hold strategy at the bottom.
(While unlikely, there's a possibility that it will touch 67.3K at the top and support at point 1. Please note this. See the analysis from yesterday, February 10th.)
Movement within the green support line and orange convergence zone is a sideways movement.
Today, depending on the Nasdaq indicator release,
variables should emerge.
I've tried to be as realistic as possible.
Please use my analysis to this point for reference only.
I hope you operate safely, with a principled trading strategy and stop-loss orders in place.
Thank you.
It's a Bitcoin Guide.
If you "follow"
You can receive real-time movement paths and comment notifications on major sections.
If my analysis was helpful,
Please click the booster button at the bottom.
This is Bitcoin's 30-minute chart.
The Nasdaq indicators will be released shortly at 10:30 AM.
*When the light blue finger moves,
this is a two-way neutral strategy: switching from short to long or holding long.
1. After touching the purple finger once at the bottom,
the light blue finger at the top indicates a short position entry point at $67,329.9.
/ Stop-loss price if the orange resistance line is broken.
2. Switch to a long position at $64,070.8. / Stop-loss price if the light blue support line is broken.
3. $68,971.8: First target for a long position -> Target price in the order of Top and Good.
The middle price of $68,041.3 can be used as a long position re-entry point.
If the first point is immediately pushed back from the current position,
this is a final long hold strategy at the bottom.
(While unlikely, there's a possibility that it will touch 67.3K at the top and support at point 1. Please note this. See the analysis from yesterday, February 10th.)
Movement within the green support line and orange convergence zone is a sideways movement.
Today, depending on the Nasdaq indicator release,
variables should emerge.
I've tried to be as realistic as possible.
Please use my analysis to this point for reference only.
I hope you operate safely, with a principled trading strategy and stop-loss orders in place.
Thank you.
Trade active
Bottom From section 2 onward, it's a double bottom, a very dangerous area.
Thank you.
Order cancelled
Hello,It's a Bitcoin Guide.
I'll check the movement since writing the analysis on February 11th.
This is a 30-minute Bitcoin chart.
I've marked the major sections with black fingers.
After confirming the touch of the purple finger (#1) at the bottom,
the light blue finger indicates a short-to-long switching strategy.
After touching the short position entry point at $67,329.9 at the top,
it failed to break through the pink resistance line
and touched the purple finger (#1) at the bottom.
It ended in a very sideways movement within the orange resistance line without breaking through the green support line.
Coupling with the Nasdaq,
the low-probability movement I described occurred.
The range of fluctuations was around $4,000,
so I wonder if you were able to take profits.
Since the order of the top and bottom has been reversed,
the strategy has been canceled.
Until a true rebound occurs,
I will continue to operate slowly and safely.
Yesterday's sideways movement may be disappointing,
but
the MACD dead cross on the Bollinger Band 4-hour chart
has now turned into a golden cross.
Considering the potential for an uptrend, a supportive movement without deviation is most important.
Currently, XAUUSD gold is also moving sideways,
but the pattern has been broken, and the Nasdaq is slowly preparing to move higher.
Let's focus from today, shall we?
I'll keep working hard today.
Thank you.

[Bitcoin Guide Affiliate]
*Bybit 20%DC Lifetime + $30,100
partner.bybit.com/b/Bitcoin_Guide
*BingX 50%DC + $14,100
bit.ly/3E8ZkAW
*ZeroMarket ECN 40%DC
bit.ly/3pY0dUv
*Telegram
t.me/bitcoinguide_TM
*Bybit 20%DC Lifetime + $30,100
partner.bybit.com/b/Bitcoin_Guide
*BingX 50%DC + $14,100
bit.ly/3E8ZkAW
*ZeroMarket ECN 40%DC
bit.ly/3pY0dUv
*Telegram
t.me/bitcoinguide_TM
Related publications
Disclaimer
The information and publications are not meant to be, and do not constitute, financial, investment, trading, or other types of advice or recommendations supplied or endorsed by TradingView. Read more in the Terms of Use.
[Bitcoin Guide Affiliate]
*Bybit 20%DC Lifetime + $30,100
partner.bybit.com/b/Bitcoin_Guide
*BingX 50%DC + $14,100
bit.ly/3E8ZkAW
*ZeroMarket ECN 40%DC
bit.ly/3pY0dUv
*Telegram
t.me/bitcoinguide_TM
*Bybit 20%DC Lifetime + $30,100
partner.bybit.com/b/Bitcoin_Guide
*BingX 50%DC + $14,100
bit.ly/3E8ZkAW
*ZeroMarket ECN 40%DC
bit.ly/3pY0dUv
*Telegram
t.me/bitcoinguide_TM
Related publications
Disclaimer
The information and publications are not meant to be, and do not constitute, financial, investment, trading, or other types of advice or recommendations supplied or endorsed by TradingView. Read more in the Terms of Use.