
Description
> Hello traders,
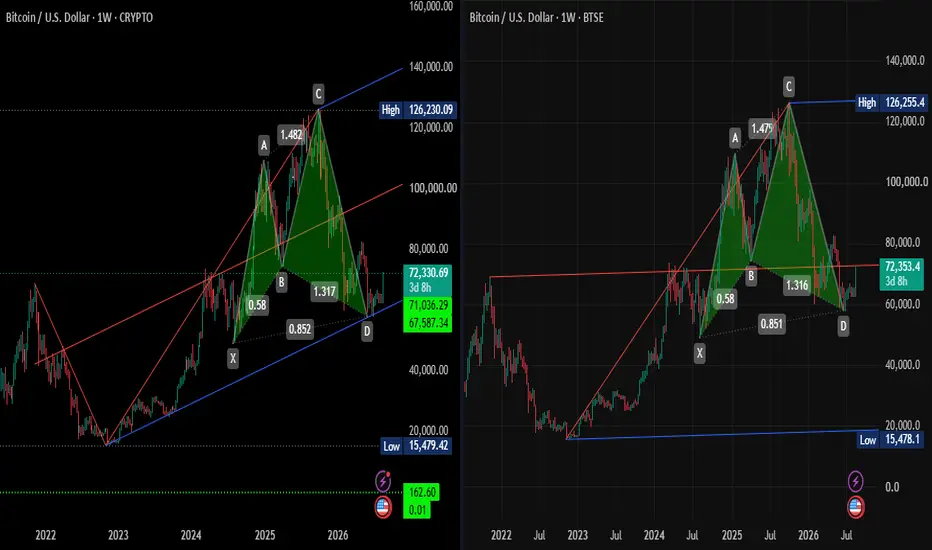
> Let's dive into the macro weekly chart of Bitcoin (BTC/USD). As we can see on this split-screen setup, a massive and beautifully structured Bullish XABCD Harmonic Pattern is currently playing out on the higher timeframe.
> Here is the technical breakdown of the current market structure:
> * The Completion of Point D: After a massive rally to the Point C peak (around the $126k mark), the market has seen a deep structural correction. The price has now reached the 'D' leg, landing precisely in our Potential Reversal Zone (PRZ) near the $72,400 area.
> * Trendline Confluence: Looking closely at the charts, Point D is perfectly aligning with a major ascending support trendline. This adds a double layer of confluence to our reversal zone.
> * Risk-to-Reward: Harmonic patterns are all about finding high-probability reversal zones. If this 'D' point holds, it offers an incredible risk-to-reward ratio for long-term positioning.
> Next Outlook:
> As long as Bitcoin defends this critical harmonic support and the ascending trendline, the bullish structure remains intact. A strong bounce from here could trigger the next macro impulse wave. However, a weekly close significantly below this trendline would invalidate the harmonic setup.
> Keep a close eye on the volume and price action at this zone!
> (Disclaimer: This chart is for educational purposes and technical observation only. Cryptocurrency markets are highly volatile, so always manage your risk and use proper stop losses.)
> Hello traders,
> Let's dive into the macro weekly chart of Bitcoin (BTC/USD). As we can see on this split-screen setup, a massive and beautifully structured Bullish XABCD Harmonic Pattern is currently playing out on the higher timeframe.
> Here is the technical breakdown of the current market structure:
> * The Completion of Point D: After a massive rally to the Point C peak (around the $126k mark), the market has seen a deep structural correction. The price has now reached the 'D' leg, landing precisely in our Potential Reversal Zone (PRZ) near the $72,400 area.
> * Trendline Confluence: Looking closely at the charts, Point D is perfectly aligning with a major ascending support trendline. This adds a double layer of confluence to our reversal zone.
> * Risk-to-Reward: Harmonic patterns are all about finding high-probability reversal zones. If this 'D' point holds, it offers an incredible risk-to-reward ratio for long-term positioning.
> Next Outlook:
> As long as Bitcoin defends this critical harmonic support and the ascending trendline, the bullish structure remains intact. A strong bounce from here could trigger the next macro impulse wave. However, a weekly close significantly below this trendline would invalidate the harmonic setup.
> Keep a close eye on the volume and price action at this zone!
> (Disclaimer: This chart is for educational purposes and technical observation only. Cryptocurrency markets are highly volatile, so always manage your risk and use proper stop losses.)

Disclaimer
The information and publications are not meant to be, and do not constitute, financial, investment, trading, or other types of advice or recommendations supplied or endorsed by TradingView. Read more in the Terms of Use.
Disclaimer
The information and publications are not meant to be, and do not constitute, financial, investment, trading, or other types of advice or recommendations supplied or endorsed by TradingView. Read more in the Terms of Use.