
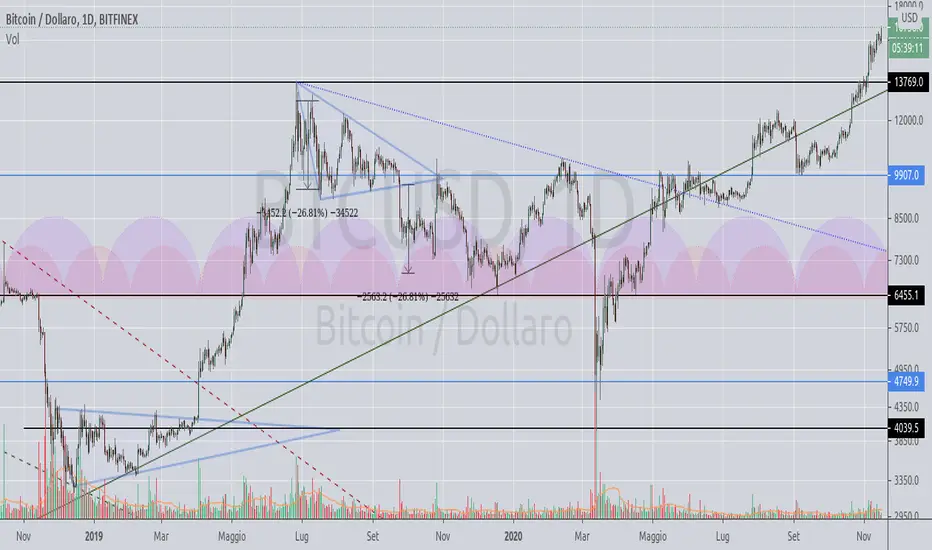
Voglio mostrarvi come hanno funzionato questi triangoli d'inversione in tutto il 2019, perfettamente validati in tutte le sue caratteristiche, nonostante il triangolo sia una figura spesso di continuazione, qui hanno fatto da pattern d'inversione:
Entrambi hanno avuto il breakout tra i 2/3 ed i 3/4 tra il primo punto e l'ipotetico apice
Entrambi hanno avuto volumi esplosivi rispetto alla media calcolata sulle 20 sessioni
Il secondo formato sui massimi di periodo addirittura ha avuto anche il pullback proprio toccando vertice
Entrambi hanno avuto il breakout tra i 2/3 ed i 3/4 tra il primo punto e l'ipotetico apice
Entrambi hanno avuto volumi esplosivi rispetto alla media calcolata sulle 20 sessioni
Il secondo formato sui massimi di periodo addirittura ha avuto anche il pullback proprio toccando vertice

Canale Telegram con approfondimenti, posizioni aperte ed eseguiti: Money management arts
Link per entrare : t.me/+DS_hgLqAJrJmZDY0
Link per entrare : t.me/+DS_hgLqAJrJmZDY0
Disclaimer
The information and publications are not meant to be, and do not constitute, financial, investment, trading, or other types of advice or recommendations supplied or endorsed by TradingView. Read more in the Terms of Use.
Canale Telegram con approfondimenti, posizioni aperte ed eseguiti: Money management arts
Link per entrare : t.me/+DS_hgLqAJrJmZDY0
Link per entrare : t.me/+DS_hgLqAJrJmZDY0
Disclaimer
The information and publications are not meant to be, and do not constitute, financial, investment, trading, or other types of advice or recommendations supplied or endorsed by TradingView. Read more in the Terms of Use.