
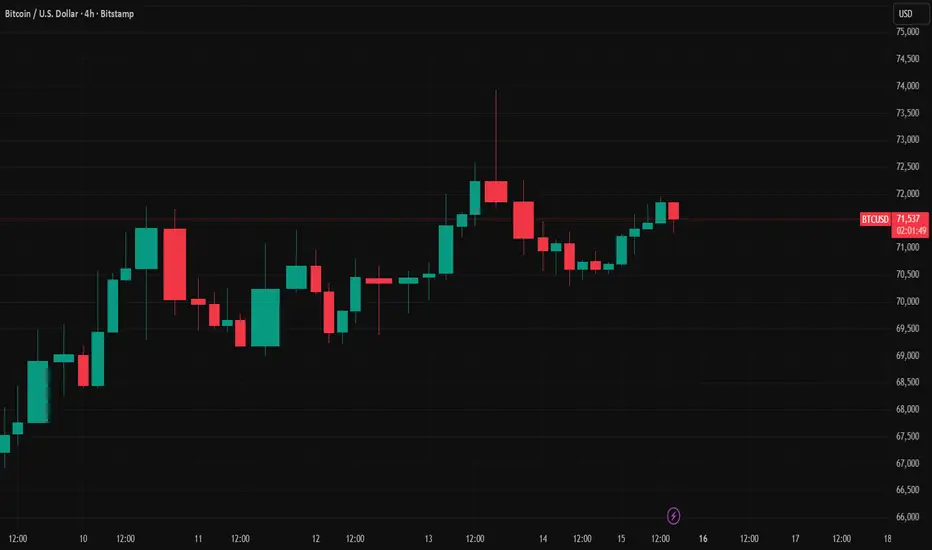
MARAL — Dynamic Risk Mapper- New script
From static trade levels to live execution intelligence
Most trade-management tools stop at drawing a few levels.
They show an entry, a stop, a target, and leave the trader alone once price starts moving.
But in live markets, that is exactly where the real problem begins.
A trader does not struggle only with where to enter.
A trader struggles with what happens after the trade is mapped:
Is price still respecting the entry zone?
Is invalidation pressure increasing?
Is TP1 close enough to require management?
Is the trade still healthy, or is momentum fading?
If price moved toward SL and came back, is that a real recovery or just noise?
Should the trader hold, protect, reduce, or exit?
That is the purpose of MARAL — Dynamic Risk Mapper Pro.
This script is built as a discretionary trade-mapping and management-support framework designed to help traders read the evolving condition of a mapped trade in a more structured and practical way.
It is not an automated system.
It does not place orders.
It does not guarantee outcomes.
It is a workflow tool built to improve clarity, execution discipline, and live management awareness.
Why this tool was built
Most traders already have enough chart tools.
What they often do not have is a system that can help them read the relationship between:
entry
invalidation
managed stop
target structure
pressure
recovery behavior
action response
in one live framework.
The goal of MARAL — Dynamic Risk Mapper Pro is to convert a manually planned trade into a living management map.
The trader provides only two core inputs:
Trade Side
Manual Entry Price
From there, the script organizes the trade into a dynamic map that continuously evaluates how price is behaving relative to that trade.
This makes the chart less about static lines and more about execution interpretation.
What the script does
Once a trade is defined, the script can map:
Base SL
Managed SL
TP1 / TP2 / TP3
invalidiation zone
momentum condition
confidence context
recovery behavior
live management posture
Instead of only asking, “Where is my stop?”, the script helps the trader ask:
What is this trade doing right now?
That shift matters.
Because a trade is not only a price level.
It is a condition that changes over time.
The example chart
This example uses BTCUSD on the 4-hour chart with a manually defined Long entry at 71,200.00.

The script has mapped:
Entry at 71,200.00
Managed SL below the trade
higher target structure above price
live panel output on the right side of the chart
What makes this example useful is that it is not showing a fully expanded winner.
It is showing a more realistic live situation:
price is still around the entry area,
momentum is not yet cleanly expanding,
the trade remains valid,
but stronger acceptance is still needed.
That is exactly the kind of situation where traders usually become emotional or impatient.
This is where the script adds value.
Panel 1 — Dynamic Risk Mapper
The first panel is the live location panel.
It explains where price is relative to the mapped trade.
In this example it shows:
Side = Long
Entry State = Near Entry
Candle Bias = Bear
Zone = Entry Zone
SL State = Safe
TP1 State = TP1 Far
Event = Trail Update
Confidence = 6.3 / 10 | Moderate
What this means
The trade is mapped for a long-side idea, but price is still working around the entry region.
The chart is not showing a clean breakout away from entry yet.
That is why the script classifies the trade as Near Entry and Entry Zone rather than “cleared” or “expanding”.
The Candle Bias = Bear reading is important.
It means the immediate candle behavior is not fully aligned with the long-side trade.
That does not automatically invalidate the map, but it does reduce short-term conviction.
At the same time, SL State = Safe tells the trader that price is not yet under immediate stop-pressure conditions.
So this is not a panic state.
It is a patience state.
TP1 State = TP1 Far also matters.
It means the trade has not reached the stage where active target-management should dominate the trader’s decision.
And the Confidence = Moderate reading communicates the exact balance of the situation:
the map is active,
the trade is still usable,
but the environment is not yet strong enough to justify aggressive confidence.
This is one of the main advantages of the tool:
it gives the trader a structured way to recognize the difference between valid and fully favored.
Those are not the same thing.
Panel 2 — Management Response Desk
The second panel is the behavior panel.
It does not focus on where price is.
It focuses on how the mapped trade is behaving.
In the example it shows:
Trade Status = Valid
Momentum = Weakening
Pressure = Low
TP1 Response = Wait
Action = Hold
What this means
The trade has not failed.
The structure is still valid.
But price is not yet delivering the kind of strong follow-through that would justify more aggressive trade confidence.
That is why Momentum = Weakening is an important reading here.
The script is not saying the trade is broken.
It is saying the trader should not confuse a valid map with a strong expansion.
This is a critical distinction in real trade management.
The Pressure = Low output is also important.
It tells the trader that while momentum is softer, the trade is not yet under high invalidation stress.
The script therefore avoids overreacting.
Then the panel shows:
TP1 Response = Wait
Action = Hold
This is another major design advantage of the tool.
Instead of forcing premature management decisions, the script recognizes that TP1 is not yet the dominant problem in this chart state.
So it does not push unnecessary partial exits or over-management.
The posture remains calm:
the map is valid,
pressure is controlled,
but stronger confirmation is still needed.
Panel 3 — Trader Guidance Panel
This is where the script becomes especially practical.
The third panel translates the live state into clear sentence-style guidance.
In the example it says:
Comment: Price is testing the entry zone.
Risk Note: The entry is active only if the zone is respected.
Next Step: Wait for acceptance before holding with confidence.
This is one of the strongest practical advantages of the script.
Most tools give technical status.
Very few tools convert that status into a readable live instruction.
This panel is designed to reduce confusion and emotional overreaction by turning technical conditions into operator guidance.
Not signals.
Not promises.
Not predictions.
Guidance.
That is a very important difference.
What this example really teaches
This example is not a chart where everything is already perfect.
That is why it is a good example.
It shows a mapped long trade that is:
still structurally valid
not under immediate stop pressure
not close enough to TP1 for target-driven management
but still lacking clean expansion away from entry
That is a realistic condition many traders face.
Without a structured map, this is exactly where traders start making mistakes:
entering too aggressively
doubting too early
tightening too soon
taking profit too early
holding with false confidence
confusing survival with strength
The script helps separate these conditions.
It helps the trader understand that:
a trade can still be valid without yet being strong.
That single distinction can improve trade-management discipline significantly.
Advantages for traders
1) Better live trade awareness
The script helps traders understand where price is relative to entry, SL, and TP structure without relying only on visual estimation.
2) More disciplined invalidation reading
Instead of reacting emotionally when price moves toward risk, traders get structured context around:
stop pressure
risk zone behavior
recovery watch
recovery confirmation
3) Clearer target-management timing
The script does not treat all target conditions the same.
It helps traders distinguish between:
TP still far
TP approaching
TP reached
target response required
4) Stronger post-entry clarity
Many tools are strongest before entry and weakest after entry.
This script is designed to stay useful after the map is active.
5) Plain-language guidance
The commentary panel reduces mental noise by converting market condition into direct trade-management language.
6) Engineering-style workflow
The structure is designed to feel more like a management console than a simple indicator stack.
That helps traders work with process, not impulse.
What this tool is not
This script is not:
a broker-connected system
an automated execution engine
a guaranteed target model
a buy/sell recommendation service
a replacement for personal judgment
It is a trade-mapping and management-support framework built to help traders operate with more structure.
Final note
Markets do not become easier because a few lines are drawn on the chart.
They become more manageable when the trader can understand:
where the trade is
what condition it is in
what pressure is changing
what response is appropriate now
That is the purpose of MARAL — Dynamic Risk Mapper
It is built to help traders move from static trade marking
to live execution intelligence.
Note : Education purpose only
From static trade levels to live execution intelligence
Most trade-management tools stop at drawing a few levels.
They show an entry, a stop, a target, and leave the trader alone once price starts moving.
But in live markets, that is exactly where the real problem begins.
A trader does not struggle only with where to enter.
A trader struggles with what happens after the trade is mapped:
Is price still respecting the entry zone?
Is invalidation pressure increasing?
Is TP1 close enough to require management?
Is the trade still healthy, or is momentum fading?
If price moved toward SL and came back, is that a real recovery or just noise?
Should the trader hold, protect, reduce, or exit?
That is the purpose of MARAL — Dynamic Risk Mapper Pro.
This script is built as a discretionary trade-mapping and management-support framework designed to help traders read the evolving condition of a mapped trade in a more structured and practical way.
It is not an automated system.
It does not place orders.
It does not guarantee outcomes.
It is a workflow tool built to improve clarity, execution discipline, and live management awareness.
Why this tool was built
Most traders already have enough chart tools.
What they often do not have is a system that can help them read the relationship between:
entry
invalidation
managed stop
target structure
pressure
recovery behavior
action response
in one live framework.
The goal of MARAL — Dynamic Risk Mapper Pro is to convert a manually planned trade into a living management map.
The trader provides only two core inputs:
Trade Side
Manual Entry Price
From there, the script organizes the trade into a dynamic map that continuously evaluates how price is behaving relative to that trade.
This makes the chart less about static lines and more about execution interpretation.
What the script does
Once a trade is defined, the script can map:
Base SL
Managed SL
TP1 / TP2 / TP3
invalidiation zone
momentum condition
confidence context
recovery behavior
live management posture
Instead of only asking, “Where is my stop?”, the script helps the trader ask:
What is this trade doing right now?
That shift matters.
Because a trade is not only a price level.
It is a condition that changes over time.
The example chart
This example uses BTCUSD on the 4-hour chart with a manually defined Long entry at 71,200.00.
The script has mapped:
Entry at 71,200.00
Managed SL below the trade
higher target structure above price
live panel output on the right side of the chart
What makes this example useful is that it is not showing a fully expanded winner.
It is showing a more realistic live situation:
price is still around the entry area,
momentum is not yet cleanly expanding,
the trade remains valid,
but stronger acceptance is still needed.
That is exactly the kind of situation where traders usually become emotional or impatient.
This is where the script adds value.
Panel 1 — Dynamic Risk Mapper
The first panel is the live location panel.
It explains where price is relative to the mapped trade.
In this example it shows:
Side = Long
Entry State = Near Entry
Candle Bias = Bear
Zone = Entry Zone
SL State = Safe
TP1 State = TP1 Far
Event = Trail Update
Confidence = 6.3 / 10 | Moderate
What this means
The trade is mapped for a long-side idea, but price is still working around the entry region.
The chart is not showing a clean breakout away from entry yet.
That is why the script classifies the trade as Near Entry and Entry Zone rather than “cleared” or “expanding”.
The Candle Bias = Bear reading is important.
It means the immediate candle behavior is not fully aligned with the long-side trade.
That does not automatically invalidate the map, but it does reduce short-term conviction.
At the same time, SL State = Safe tells the trader that price is not yet under immediate stop-pressure conditions.
So this is not a panic state.
It is a patience state.
TP1 State = TP1 Far also matters.
It means the trade has not reached the stage where active target-management should dominate the trader’s decision.
And the Confidence = Moderate reading communicates the exact balance of the situation:
the map is active,
the trade is still usable,
but the environment is not yet strong enough to justify aggressive confidence.
This is one of the main advantages of the tool:
it gives the trader a structured way to recognize the difference between valid and fully favored.
Those are not the same thing.
Panel 2 — Management Response Desk
The second panel is the behavior panel.
It does not focus on where price is.
It focuses on how the mapped trade is behaving.
In the example it shows:
Trade Status = Valid
Momentum = Weakening
Pressure = Low
TP1 Response = Wait
Action = Hold
What this means
The trade has not failed.
The structure is still valid.
But price is not yet delivering the kind of strong follow-through that would justify more aggressive trade confidence.
That is why Momentum = Weakening is an important reading here.
The script is not saying the trade is broken.
It is saying the trader should not confuse a valid map with a strong expansion.
This is a critical distinction in real trade management.
The Pressure = Low output is also important.
It tells the trader that while momentum is softer, the trade is not yet under high invalidation stress.
The script therefore avoids overreacting.
Then the panel shows:
TP1 Response = Wait
Action = Hold
This is another major design advantage of the tool.
Instead of forcing premature management decisions, the script recognizes that TP1 is not yet the dominant problem in this chart state.
So it does not push unnecessary partial exits or over-management.
The posture remains calm:
the map is valid,
pressure is controlled,
but stronger confirmation is still needed.
Panel 3 — Trader Guidance Panel
This is where the script becomes especially practical.
The third panel translates the live state into clear sentence-style guidance.
In the example it says:
Comment: Price is testing the entry zone.
Risk Note: The entry is active only if the zone is respected.
Next Step: Wait for acceptance before holding with confidence.
This is one of the strongest practical advantages of the script.
Most tools give technical status.
Very few tools convert that status into a readable live instruction.
This panel is designed to reduce confusion and emotional overreaction by turning technical conditions into operator guidance.
Not signals.
Not promises.
Not predictions.
Guidance.
That is a very important difference.
What this example really teaches
This example is not a chart where everything is already perfect.
That is why it is a good example.
It shows a mapped long trade that is:
still structurally valid
not under immediate stop pressure
not close enough to TP1 for target-driven management
but still lacking clean expansion away from entry
That is a realistic condition many traders face.
Without a structured map, this is exactly where traders start making mistakes:
entering too aggressively
doubting too early
tightening too soon
taking profit too early
holding with false confidence
confusing survival with strength
The script helps separate these conditions.
It helps the trader understand that:
a trade can still be valid without yet being strong.
That single distinction can improve trade-management discipline significantly.
Advantages for traders
1) Better live trade awareness
The script helps traders understand where price is relative to entry, SL, and TP structure without relying only on visual estimation.
2) More disciplined invalidation reading
Instead of reacting emotionally when price moves toward risk, traders get structured context around:
stop pressure
risk zone behavior
recovery watch
recovery confirmation
3) Clearer target-management timing
The script does not treat all target conditions the same.
It helps traders distinguish between:
TP still far
TP approaching
TP reached
target response required
4) Stronger post-entry clarity
Many tools are strongest before entry and weakest after entry.
This script is designed to stay useful after the map is active.
5) Plain-language guidance
The commentary panel reduces mental noise by converting market condition into direct trade-management language.
6) Engineering-style workflow
The structure is designed to feel more like a management console than a simple indicator stack.
That helps traders work with process, not impulse.
What this tool is not
This script is not:
a broker-connected system
an automated execution engine
a guaranteed target model
a buy/sell recommendation service
a replacement for personal judgment
It is a trade-mapping and management-support framework built to help traders operate with more structure.
Final note
Markets do not become easier because a few lines are drawn on the chart.
They become more manageable when the trader can understand:
where the trade is
what condition it is in
what pressure is changing
what response is appropriate now
That is the purpose of MARAL — Dynamic Risk Mapper
It is built to help traders move from static trade marking
to live execution intelligence.
Note : Education purpose only

MARAL Execution Workflow, Long & Short Permission , Dynamic risk mapper & Deep Candle Intelligence
Context → Liquidity Event → Displacement → Structure Shift → POI Confirmation → Risk Clearance (Discretionary | Educational)
Context → Liquidity Event → Displacement → Structure Shift → POI Confirmation → Risk Clearance (Discretionary | Educational)
Related publications
Disclaimer
The information and publications are not meant to be, and do not constitute, financial, investment, trading, or other types of advice or recommendations supplied or endorsed by TradingView. Read more in the Terms of Use.
MARAL Execution Workflow, Long & Short Permission , Dynamic risk mapper & Deep Candle Intelligence
Context → Liquidity Event → Displacement → Structure Shift → POI Confirmation → Risk Clearance (Discretionary | Educational)
Context → Liquidity Event → Displacement → Structure Shift → POI Confirmation → Risk Clearance (Discretionary | Educational)
Related publications
Disclaimer
The information and publications are not meant to be, and do not constitute, financial, investment, trading, or other types of advice or recommendations supplied or endorsed by TradingView. Read more in the Terms of Use.