
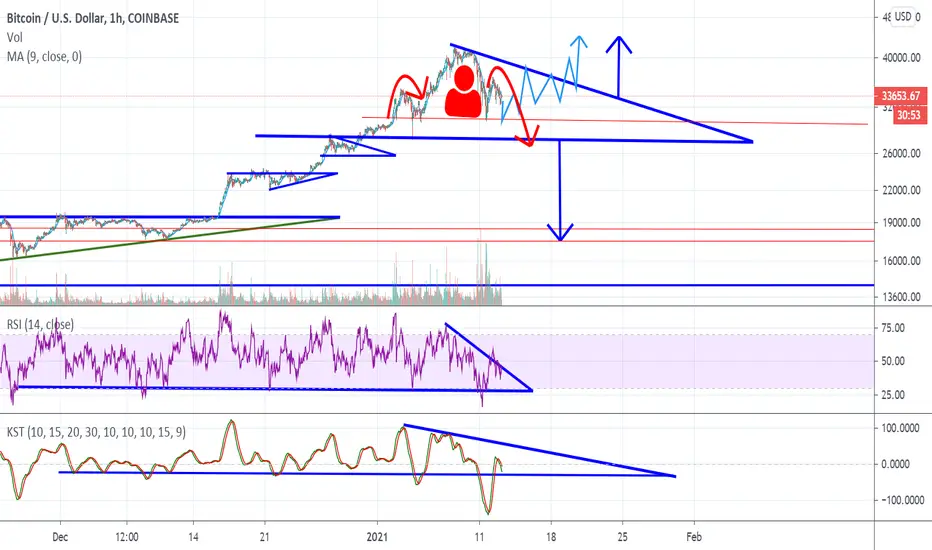
Bitcoin is potentially forming a giant H&S pattern inside of a larger Descending Triangle or Bullish Flag.
In light blue, I have drawn a hypothetical price scenario.
The RSI is breaking the downward sloping resistance of a descending triangle formation.
The KST saw a sharp deviation but has since found itself back into what could turn out as a bull flag or descending triangle.
In Dark Red inside the price pattern is potentially an H&S pattern.
In light blue, I have drawn a hypothetical price scenario.
The RSI is breaking the downward sloping resistance of a descending triangle formation.
The KST saw a sharp deviation but has since found itself back into what could turn out as a bull flag or descending triangle.
In Dark Red inside the price pattern is potentially an H&S pattern.
Note
Bullish cross now apparent on the KST, updated chart here.. 

Related publications
Disclaimer
The information and publications are not meant to be, and do not constitute, financial, investment, trading, or other types of advice or recommendations supplied or endorsed by TradingView. Read more in the Terms of Use.
Related publications
Disclaimer
The information and publications are not meant to be, and do not constitute, financial, investment, trading, or other types of advice or recommendations supplied or endorsed by TradingView. Read more in the Terms of Use.