
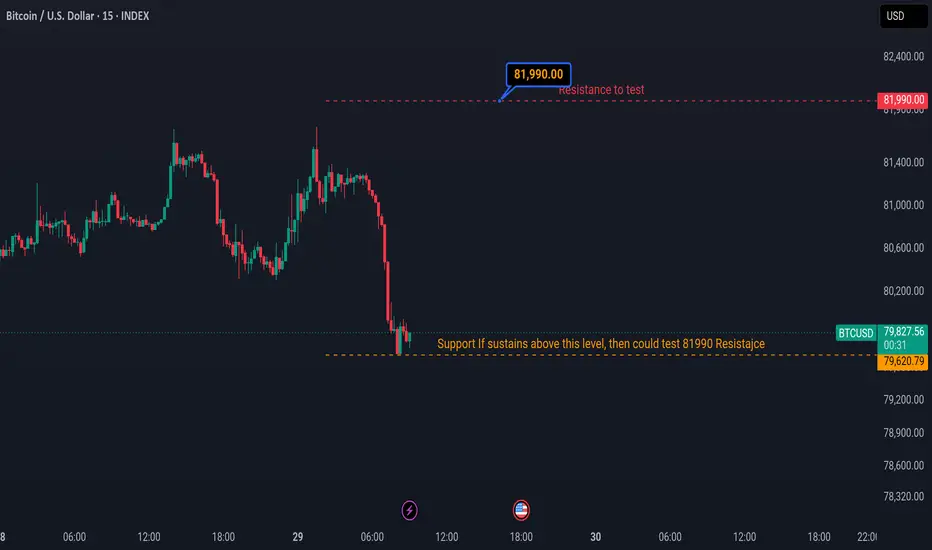
BTCUSD 15m: Technical Resistance and Support
Breakdown Plan
• Ticker: BTCUSD (Bitcoin / U.S. Dollar) via INDEX
• Timeframe: 15-Minute (15m)
• Current Price: 79,718.33 USD (-0.04%)
Key Technical Levels
• Overhead Resistance Target: 81,990.00 USD (Critical structural barrier marked as: "Resistance to test")
• Defined Support Base: 79,620.79 USD (The key horizontal floor marked by the label: "Support if sustains above this level, then could test 81990 Resistance")
Market Analysis & Structural Outlook
• Price Action: Following a period of distribution at local highs above the 81,400 USD mark, Bitcoin has experienced a sharp, aggressive downward expansion leg. The sudden influx of selling pressure has rapidly driven prices lower, leading into a direct retest of immediate horizontal demand.
• Current Framework: The asset is currently stabilizing directly above a crucial make-or-break horizontal baseline. Sellers have aggressively driven the price down, forcing a dynamic test of internal demand where buyers must step in to halt the corrective momentum.
• Execution Projection: If price action manages to sustain and consolidate above the 79,620.79 USD support baseline, a strong structural rotation back to the upside is projected to develop. This defense maps out a bullish recovery path to test the major 81,990.00 USD overhead resistance level.
Legal Compliance & Financial Disclaimer
This analysis is published strictly for educational and informational purposes only. It does not constitute financial, investment, trading, or legal advice. Trading cryptocurrencies such as Bitcoin carries a high level of risk and may not be suitable for all investors. The high degree of leverage can work against you as well as for you. Before deciding to trade bitcoin spot contracts, you should carefully consider your investment objectives, level of experience, and risk appetite. Past performance is not indicative of future market results. You should execute your own independent research and consult a certified financial advisor before placing capital at risk in live financial markets. The author assumes no liability for any financial loss incurred directly or indirectly from the use of this information.
Trade closed: target reached
Educational Follow-Up / Structural Update• The Framework: The technical framework mapped out in the original study has completed its structural rotation.
• Price Action Resolution: As observed, the strong defense above the 79,620.79 USD support baseline sustained absolute buyer control and prevented any further downside extension.
• Target Met: This bullish defense resulted in a clean upward expansion leg to test the major horizontal resistance ceiling at 81,990.00 USD, hitting the exact "Resistance to test" level before minor selling interest arrived.

Disclaimer
The information and publications are not meant to be, and do not constitute, financial, investment, trading, or other types of advice or recommendations supplied or endorsed by TradingView. Read more in the Terms of Use.
Disclaimer
The information and publications are not meant to be, and do not constitute, financial, investment, trading, or other types of advice or recommendations supplied or endorsed by TradingView. Read more in the Terms of Use.