
Market Footprinting Trading Concept
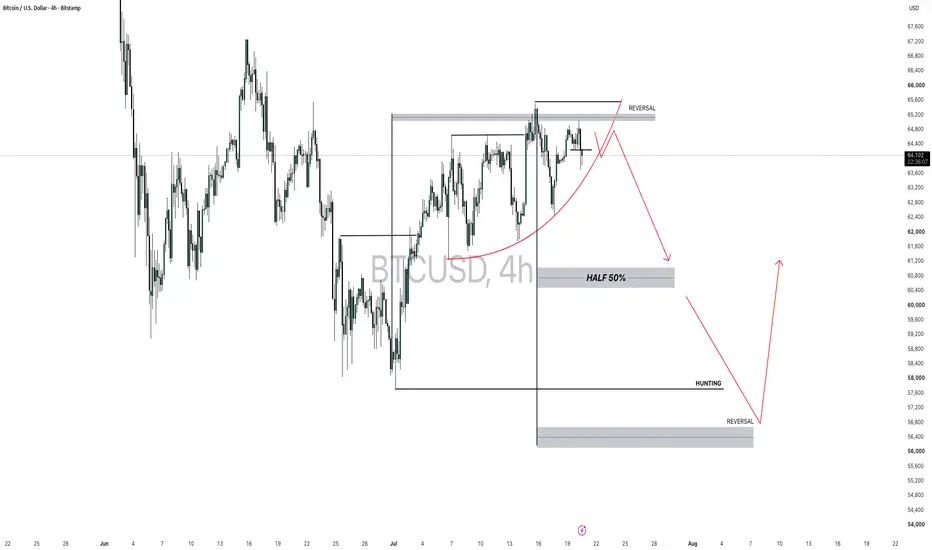
Bitcoin is currently trading inside a major 4-hour structural demand zone, but according to the Market Footprinting Trading Concept, this demand has already been 100% mitigated. The repeated reactions from this area suggest that buying pressure is gradually weakening.
On the 4H chart, an Initial Reversal (I.R.) formation is developing near the upper supply/reversal zone. This indicates that the market may be preparing for a bearish move rather than a continuation to the upside.
The most important confirmation will be the breakdown of the current rising curve structure. If price loses this curved support, it would signal that bullish momentum has faded and sellers are taking control.
Trading Plan
Bias: Bearish
Higher Timeframe: 4H
Confirmation Needed: Break below the rising curve
Lower Timeframe Entry: Wait for a Rising Wedge to form on the 5-minute or 1-minute chart, then look for an Initial Reversal (I.R.) confirmation before entering a short position.
Risk Management: Avoid selling before confirmation. Let the market confirm the breakdown first.
Key Market Footprinting View
✅ 4H structural demand is fully mitigated.
✅ 4H I.R. formation is developing near the reversal zone.
✅ Breakdown of the rising curve would confirm bearish momentum.
✅ 5M–1M Rising Wedge + I.R. confirmation provides the ideal sell entry.
🎯 A move toward the 50% structural demand area becomes the first downside objective. If bearish momentum continues, price could extend toward the lower liquidity/reversal zone.
Note: This is an educational analysis based on the Market Footprinting Trading Concept. Always wait for confirmation and follow proper risk management before taking any trade.
Bitcoin is currently trading inside a major 4-hour structural demand zone, but according to the Market Footprinting Trading Concept, this demand has already been 100% mitigated. The repeated reactions from this area suggest that buying pressure is gradually weakening.
On the 4H chart, an Initial Reversal (I.R.) formation is developing near the upper supply/reversal zone. This indicates that the market may be preparing for a bearish move rather than a continuation to the upside.
The most important confirmation will be the breakdown of the current rising curve structure. If price loses this curved support, it would signal that bullish momentum has faded and sellers are taking control.
Trading Plan
Bias: Bearish
Higher Timeframe: 4H
Confirmation Needed: Break below the rising curve
Lower Timeframe Entry: Wait for a Rising Wedge to form on the 5-minute or 1-minute chart, then look for an Initial Reversal (I.R.) confirmation before entering a short position.
Risk Management: Avoid selling before confirmation. Let the market confirm the breakdown first.
Key Market Footprinting View
✅ 4H structural demand is fully mitigated.
✅ 4H I.R. formation is developing near the reversal zone.
✅ Breakdown of the rising curve would confirm bearish momentum.
✅ 5M–1M Rising Wedge + I.R. confirmation provides the ideal sell entry.
🎯 A move toward the 50% structural demand area becomes the first downside objective. If bearish momentum continues, price could extend toward the lower liquidity/reversal zone.
Note: This is an educational analysis based on the Market Footprinting Trading Concept. Always wait for confirmation and follow proper risk management before taking any trade.

Disclaimer
The information and publications are not meant to be, and do not constitute, financial, investment, trading, or other types of advice or recommendations supplied or endorsed by TradingView. Read more in the Terms of Use.
Disclaimer
The information and publications are not meant to be, and do not constitute, financial, investment, trading, or other types of advice or recommendations supplied or endorsed by TradingView. Read more in the Terms of Use.