
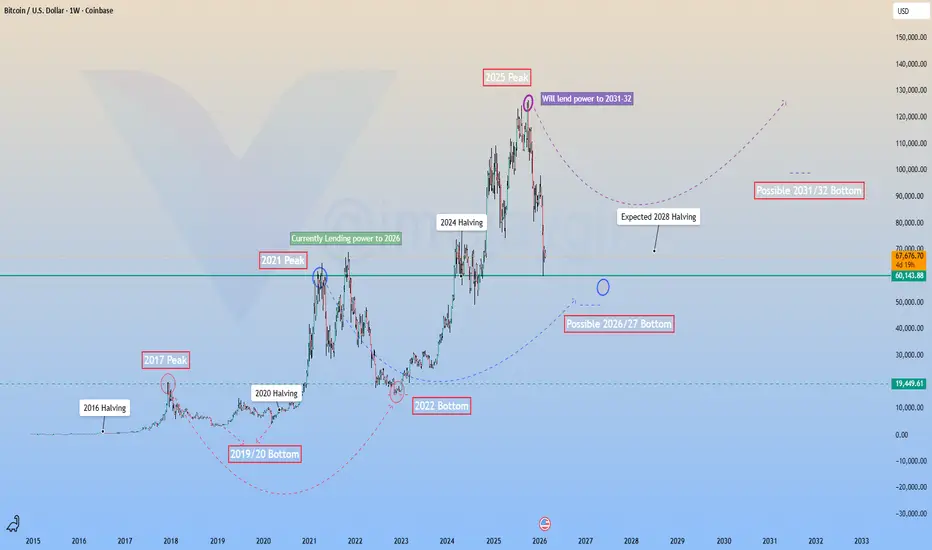
Analyzing BTC on the weekly timeframe gives a clear view of how it forms a bottom after making a new ATH and completing a cycle.
Starting from the 2017 cycle, we can observe that the previous cycle’s ATH tends to act as strong support for the next cycle’s bottom. The price may not hold the exact level, but it usually stays within a possible 20 percent deviation range.
I have plotted most of my findings on the chart. If you have any questions, drop them in the comments and I’ll be happy to discuss the concepts. If you follow a different theory, share it as well and let’s break it down together.
Starting from the 2017 cycle, we can observe that the previous cycle’s ATH tends to act as strong support for the next cycle’s bottom. The price may not hold the exact level, but it usually stays within a possible 20 percent deviation range.
I have plotted most of my findings on the chart. If you have any questions, drop them in the comments and I’ll be happy to discuss the concepts. If you follow a different theory, share it as well and let’s break it down together.

Disclaimer
The information and publications are not meant to be, and do not constitute, financial, investment, trading, or other types of advice or recommendations supplied or endorsed by TradingView. Read more in the Terms of Use.
Disclaimer
The information and publications are not meant to be, and do not constitute, financial, investment, trading, or other types of advice or recommendations supplied or endorsed by TradingView. Read more in the Terms of Use.